SeeReduceInsure

Specialty InsuranceFor Energy Infrastructure.

One connected Risk Intelligence system — closing the insurance gap to make energy infrastructure resilient and bankable.

For the owners, investors, and lenders who finance it.

How it works ↓
The problem

Energy infrastructure is being repriced. The insurance under it has not kept up.

Exposure is modelled on regional averages rather than the asset. Contract risk goes unmodelled though it carries the revenue and the credit. And capacity is being rationed to the assets that can prove resilience — everyone else pays up or goes uncovered.

$380B
global natural-catastrophe economic losses, 2023
Source: Aon, 2024 Climate and Catastrophe Insight
69%
of it uninsured
Source: $118B of $380B insured — Aon, 2024 Climate and Catastrophe Insight
$5–10B
the ceiling on infrastructure policy limits
Source: against hyperscale campuses insured at $20–30B — S&P Global Ratings via Insurance Journal, 2026
How risk reprices through the capital stack
  1. Step 0
    Priced in upfront
    At evaluation
    resilience & insurance as terms
  2. Step 1
    Risk event
    Year 0
    hazard · contract · market · policy
  3. Step 2
    Insurance reprices
    Year 1
    premium · exclusions · capacity
  4. Step 3
    Debt adjusts
    Year 2–3
    rate · covenants · sizing
  5. Step 4
    Valuation resets
    Year 4–5+
    bid · hold · exit

Resilience and insurance are the load-bearing walls of modern infrastructure finance.

They are what debt, equity, and a bankable close stand on.

Meta and BlackRock's $14bn data centre exposes lenders to insurance gap

Investors in gigawatt-scale campuses face billions in underinsured risks as insurers balk at cost of full coverage.

Financial Times · August 2026

The infrastructure we work across

  • Power generation
  • Renewables
  • Storage
  • Transmission & substations
  • Data centers
  • Pipelines
  • Oil & gas
The solution

One Risk Intelligence system. Three steps.

InfraSure builds a forward-looking, localized, asset-specific model of each asset. It is part physical twin, part financial twin: site conditions, components, contracts, debt, revenue mechanics, the insurance program, and resilience options all recompute through the same scenario engine.

The exposure that surfaces a red flag when you see the risk sizes the hardening case when you reduce it, and prices the cover when you insure it. Change one input — add a battery, raise a deductible — and all three recompute against it. Scenario analysis is built in, not bolted on.

Scenario paths for weather, hazards, prices, revenue, coverage, and DSCR.
Site-level hazard, grid, nodal, corridor, and market context.
Components, subsystems, contracts, the insurance program, leverage, and resilience levers.
Weather
Hazard
Grid
Equipment
Policy
Contracts
Debt
Revenue
Insurance
Resilience
Risk Intelligence
physical state + financial structure + scenario engine
See the risk
Reduce the risk
Insure the risk
How the asset is configured, how it fails, how it recovers.
What reaches it, where, how often — and how the tail behaves.
What it means for cash, cover, covenants, and the close.
The same model supports screening, resilience, bankability, and cover decisions — bought separately or together.
1Step 1 of 3

See the risk

Assess

Screen the portfolio for the exposures that deserve attention — climate value-at-risk, peak hazard, red flags — then resolve the asset that matters: hazard by hazard, contract by contract, down to the position you defend.

1.1
Screen
Portfolio-wide exposure, red flags, and peer benchmarks in one view.
1.2
Resolve
Expected and tail loss by hazard and return period at the asset that matters.
1.3
Stress
Generation, revenue, and cash flow against covenants and contracts.
app.infrasure.ai
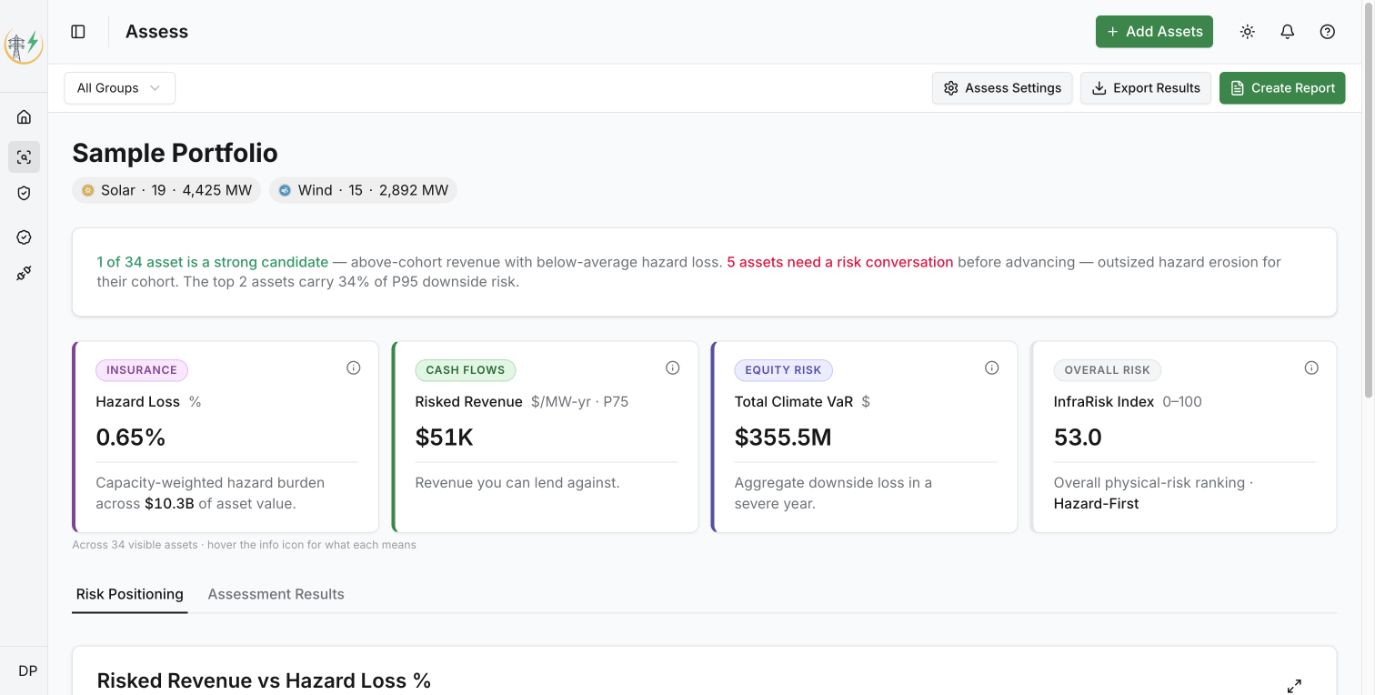
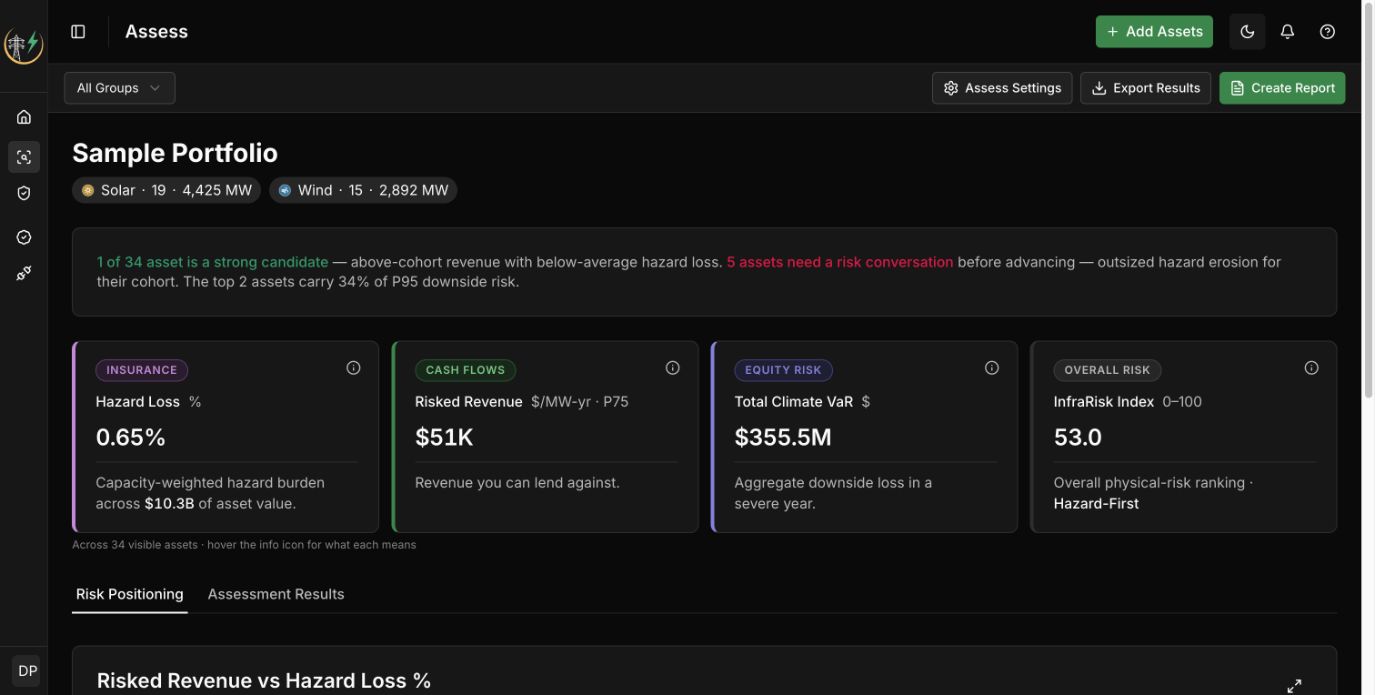
InfraSure Assess overview for the Sample Portfolio, showing 34 solar and wind assets with hazard loss, risked revenue, total Climate VaR, and the InfraRisk Index.
One portfolio view for 34 assets: 0.65% capacity-weighted hazard loss, $51K/MW-year P75 risked revenue, $355.5M total Climate VaR, and the assets that need a risk conversation.

Resilience is an investment-evaluation input, not a post-close fix.

Site selection $Diligence $$Close $$$Construction $$$$

Insurability and resilience constraints surface cheapest at site selection — screening puts them there, before capital commits.

Portfolio screen: climate value-at-risk, peak hazard, red flags, and peer benchmarks across every utility-scale plant in the U.S.
Asset view: expected and tail loss by hazard at 100-, 200-, and 500-year return periods
Generation, revenue, and DSCR against covenants — assumptions adjustable, re-modeled live

The screen finds the question; the asset view shows what the decision depends on. A fund-level screen stands on its own.

2Step 2 of 3

Reduce the risk

Resilience ROI

Pair a named measure — hail stow, winterization, vegetation management — to the untreated baseline and re-run the consequence: loss, downtime, the tail, the limit you need, and the return on the spend.

2.1
Baseline
The untreated asset, hazard by hazard.
2.2
Measure
One named intervention, re-run through the same models.
2.3
Compare
Loss, downtime, tail, limit need, and return — side by side.
app.infrasure.ai
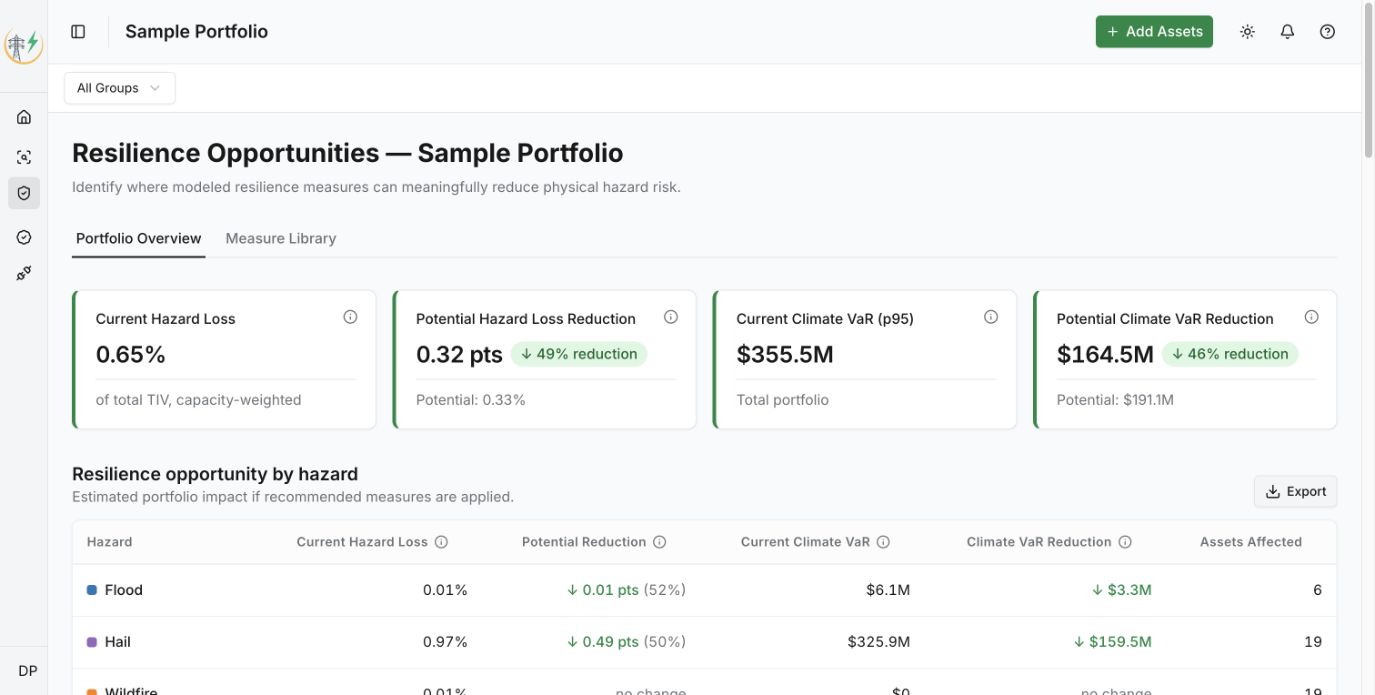
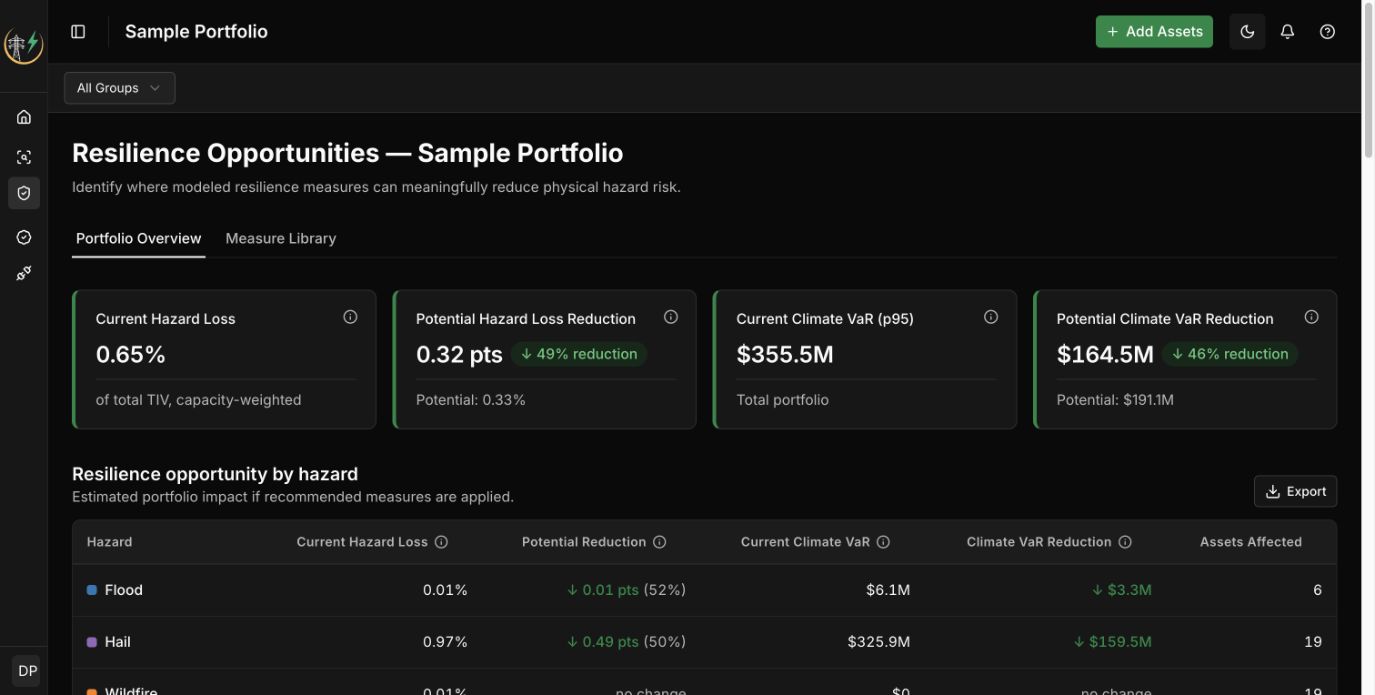
InfraSure Resilience Opportunities overview for the same Sample Portfolio, showing current and potential hazard loss and Climate VaR reductions.
The same 34-asset portfolio, now read for resilience: modeled measures reduce potential hazard loss by 49% and Climate VaR by $164.5M, or 46%.

"Lower expected loss" and "protected against catastrophe" are different statements — a measure can remove most ordinary losses and still fail at its design threshold. We show both.

Named measures paired to the untreated baseline — a comparison, not a resilience score
Damage, downtime, recovery, and the tail — before and after the measure
Cost against avoided loss, and the change in the cover you need

Resilience is measured, not asserted — and it changes what insurance should cost.

3Step 3 of 3

Insure the risk

Risk transfer

Cover the operating exposures traditional policies leave behind — performance security, revenue shortfall, and power-outage interruption. Structure the trigger, terms, limit, and capacity around the promise.
3.1
Define
Identify the measurable performance, revenue, or outage exposure.
3.2
Structure
Set the trigger, terms, limit, and capacity.
3.3
Assure
Write the supported performance, revenue, or outage promise.
poweroutage.modeling.infrasure.ai
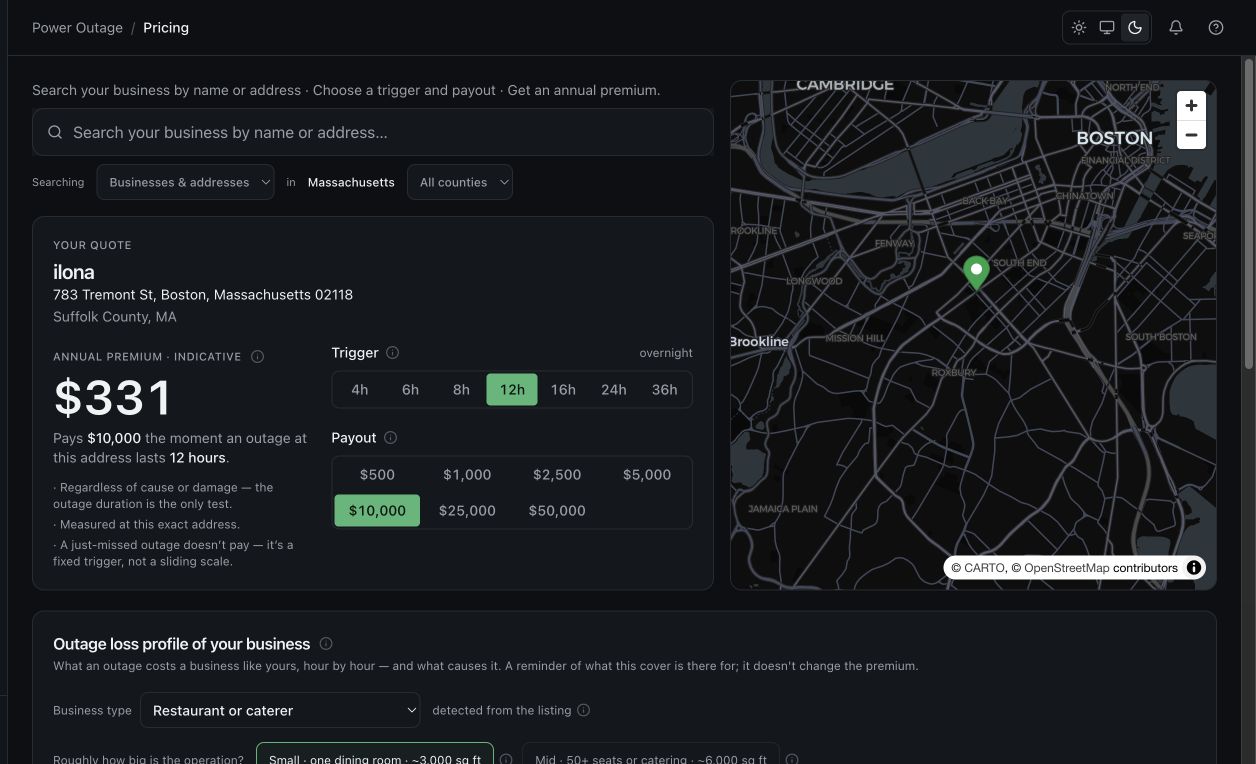
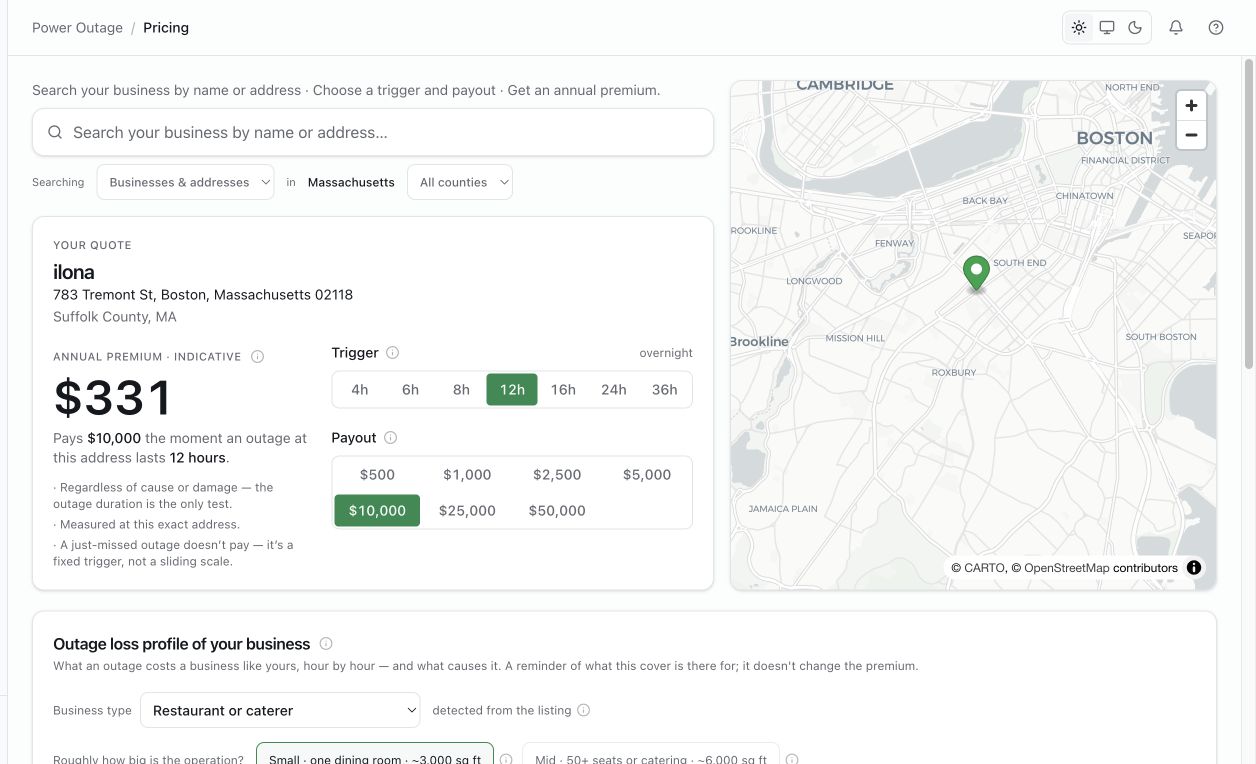
Power Outage Insurance quote for a Boston business showing a $331 indicative annual premium, a $10,000 payout triggered by a 12-hour outage, and the insured-address map.
Power Outage Insurance shown as the current product example: $331 indicative annual premium for a $10,000 payout when grid power is out for 12 hours — one supported specialty cover within the wider risk-transfer layer.
Performance security and revenue-shortfall assurance — where supported
Power-outage interruption cover built around a measurable duration trigger
Terms, limits, and capacity connected to the asset's operating obligations

Assessment identifies the exposure. Underwriting defines the supported promise — trigger, terms, limit, and capacity.

Why InfraSure

The advantages compound.

Each of these five advantages strengthens the others. The platform grows stronger with every asset added.

Data Foundation

A stable identity spine connects each facility and resource unit to physical systems and components, equipment ratings, locations, owners and parent entities, performance, and financial evidence. Manufacturer and supplier detail attaches only where the record supports it. Filings, contracts, and news are resolved to the same assets through proprietary research pipelines.

Engineering, Science & Finance

Engineering carries configuration, failure, protection, and recovery. Science carries the condition, distribution, tail, and uncertainty. Finance carries value, contracts, cash flow, and capital constraints; underwriting translates the supported risk into eligibility, terms, limits, and monitoring. One asset, one evidence base, one path from physical response to cash, cover, and covenants.

Market-Scale Coverage

Every utility-scale plant in the U.S. contributes to a consistent national reference surface — not only the assets a client already owns. Portfolio screening reveals outliers, concentrations, and missing evidence; decision deep dives move to the site, subsystem, component, contract, or dependency the question requires. The screen finds the question; depth is reserved for decisions that warrant it.

Validation Discipline

Katrina, Uri, Camp Fire, and the 2020 Derecho provide historical-event checks. Hazard calibration, tail checks against published catastrophe parameters, and generation hindcasts against EIA actuals challenge different links in the chain. Sources and practitioner-level methods stay attached to each result — including where uncertainty or evidence gaps limit its use.

Problem-First AI

Most of InfraSure's AI works behind the product, accelerating evidence research, document extraction, data curation and reconciliation, model development, and quality checks. In the foreground, grounded research assistants open the record, while experimental ContractAI turns complex agreements into typed, reviewable facts. The problem selects the model; engineering, science, finance, and expert controls determine what the result can support.

InfraSure's advantage comes from combining market-scale coverage, unified modeling, and continuous validation in a single framework.

The open foundation

Every U.S. utility-scale plant. Every queue project. Every market signal. Open.

The same asset registry that powers our modeling layer is yours to explore.

Ready to see it on your own portfolio?

Price the risk before the market does.

We’ll walk you through your own portfolio in 30 minutes — the screening view, the asset-level diligence, the mitigation economics. One asset of yours, end to end.

info@infrasure.ai