Evaluate · Manage · Mitigate

Decision-grade underwriting, risk, performance, insurability, and resiliency intelligence for energy infrastructure capital.

Forward-looking, hyperlocal, asset-specific risk and performance intelligence — built for the lenders, insurers, and equity financing the next $9 trillion of energy infrastructure.

See how it works ↓
The macro problem

Infrastructure is being repriced. Risk analytics haven’t caught up.

$380B
weather-driven infrastructure losses, 2023
Aon Catastrophe Insight, 2023
60%
of those losses uninsured
$228B protection gap
400%
insurance premium hikes in exposed corridors
Reinsurance market commentary
The repricing cascade
Step 1
Hazard event
Year 0
Step 2
Insurance reprices
Year 1
Step 3
Debt adjusts
Year 2–3
Step 4
Equity re-rates
Year 4–5+

Today’s vulnerabilities are tomorrow’s uninsured exposure, are next year’s loan defaults, are the year-after’s equity underperformance.

The cascade is accelerating. Flood took decades. Hail took five years. Wildfire is on a two-year cycle.
The structural problem

Three silos of interdependent capital operate on incompatible data.

Insurer, lender and equity capital finance the same physical asset — yet model risk with incompatible language and data on divergent time horizons.

Insurer

1 year
Model focus
Tail events, claims frequency
Data foundation
Annual claims, exposure data
Output
Premium, limit, deductible

Lender

5–7 years
Model focus
Default probability, DSCR coverage
Data foundation
Credit history, macro indicators
Output
Loan size, rate, covenants

Equity

20+ years
Model focus
IRR distributions, terminal value, debt capacity
Data foundation
Project cashflow assumptions
Output
Equity check, IRR target, hold period

A better risk analytics layer is needed to connect across each perspective.

The InfraSure platform

One analytical framework. Three workflows.

The hazard exposure that surfaces a red flag in Evaluate drives the DSCR stress in Manage and prices the parametric trigger in Mitigate. Change one input — say, add a battery — and all three workflows recompute against it. Scenario analysis is built in, not bolted on.

1Workflow 1 of 3

Evaluate

Screen + Compare

Top-of-funnel diligence at portfolio scale. You leave with an evidence-grounded prioritization — not a recommendation, an answer to which assets deserve the underwriting time.
1.1
Load
Bulk-upload or pick from the 15K-asset registry; the models run automatically.
1.2
Screen
InfraRisk scores, hazard loss-ratio heatmap, and red-flag detection benchmarked against peers.
1.3
Prioritize
An evidence-grounded list of what deserves your underwriting time.
app.infrasure.ai
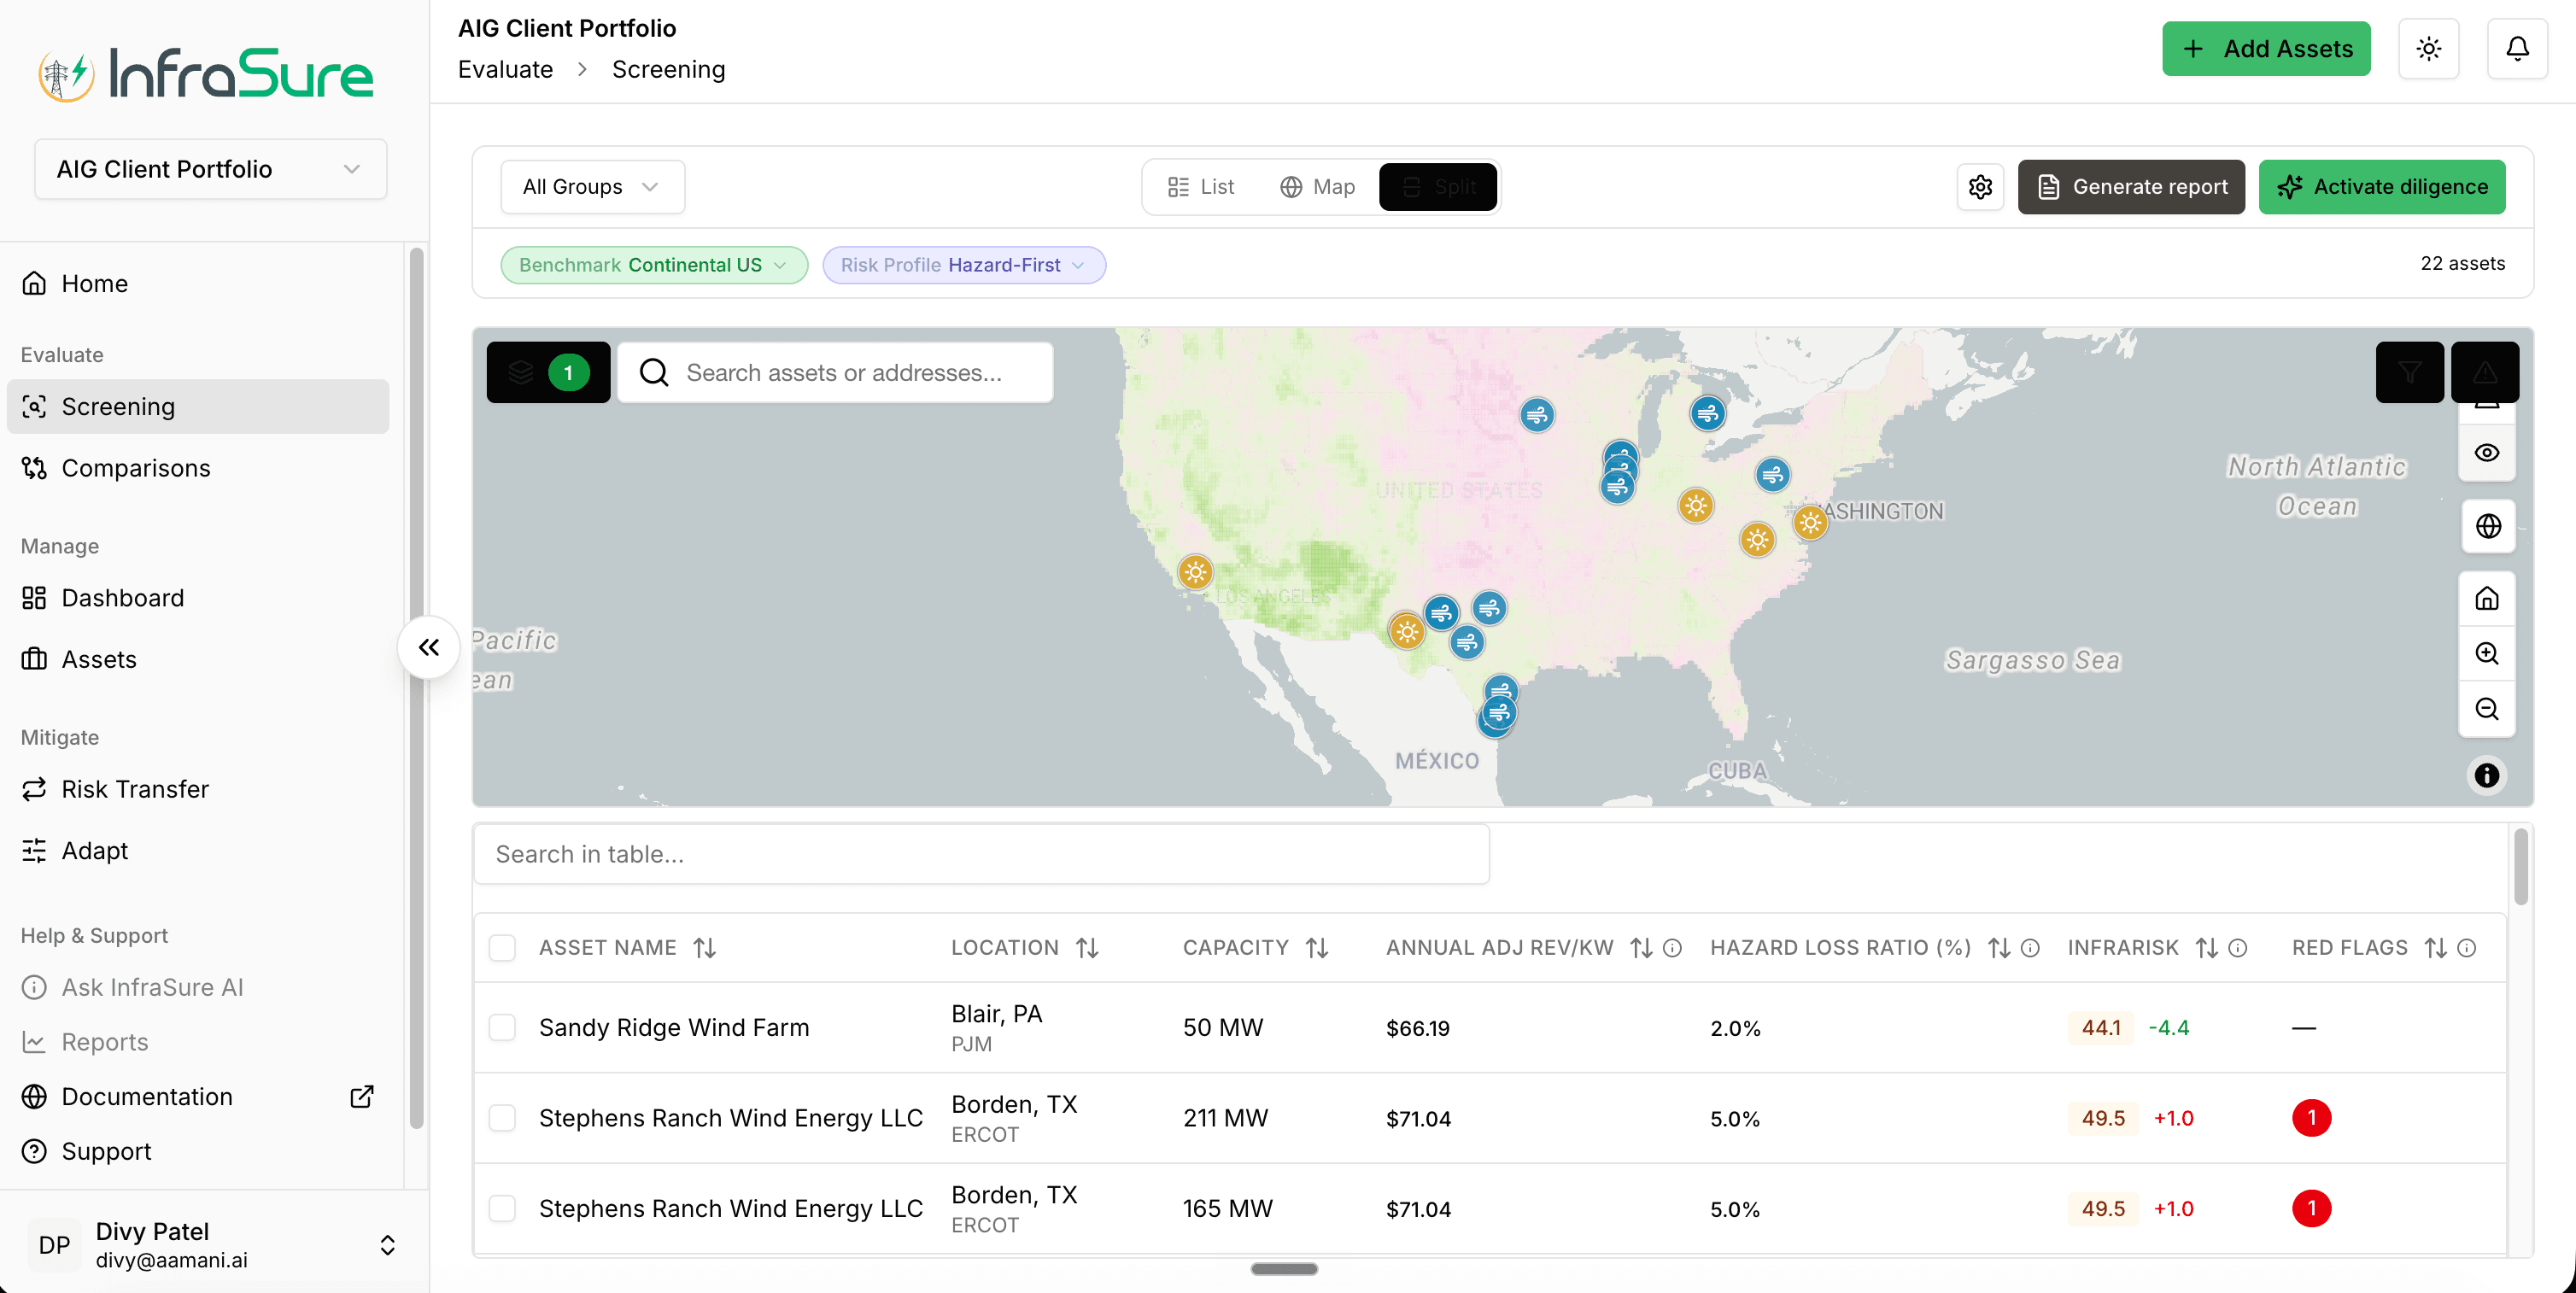
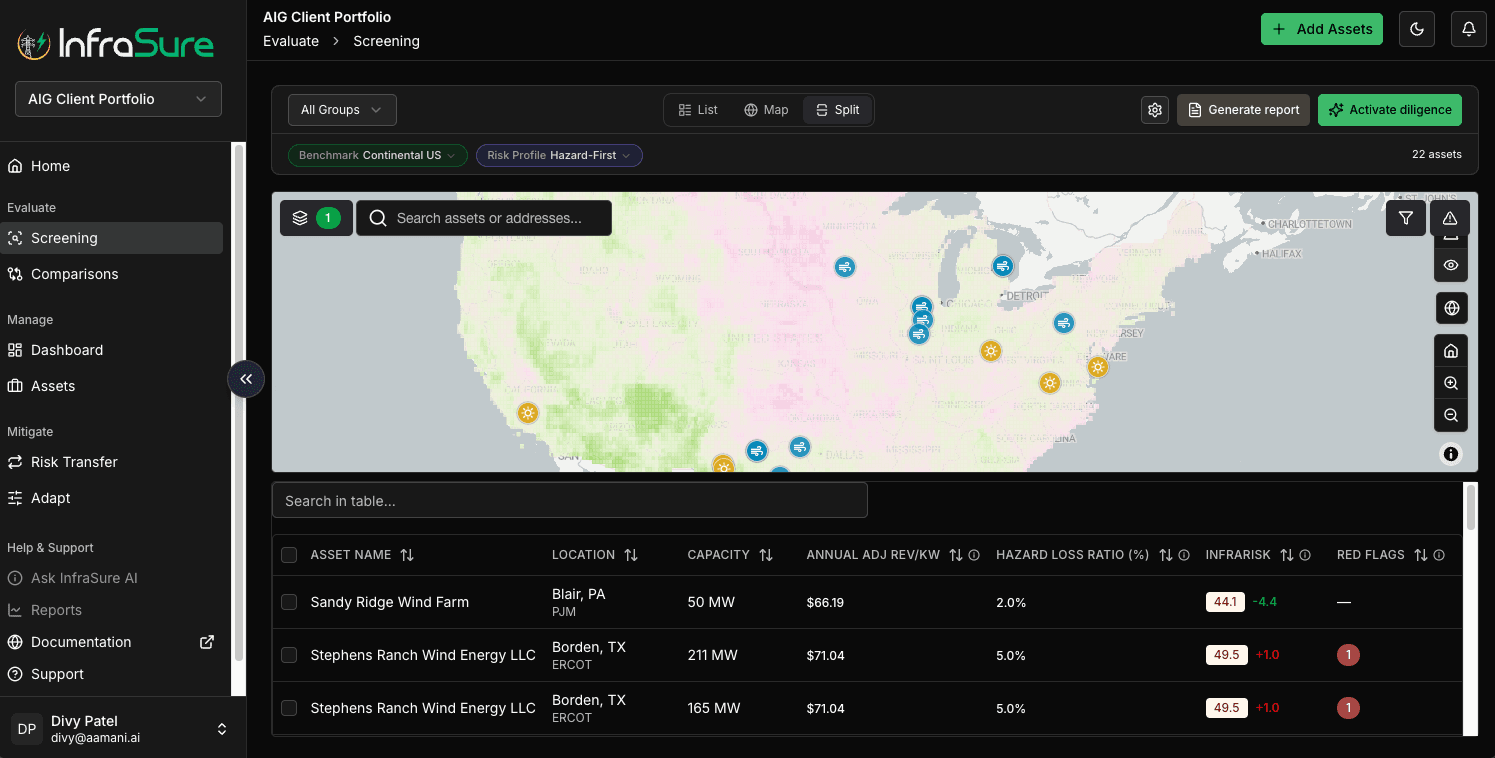
Evaluate / Screening view — split-pane US map with hazard overlay plus a sortable table of 22 portfolio assets showing InfraRisk scores, hazard loss ratio percentages, adjusted revenue per kW, and red flag counts.
Sortable screening view across a 22-asset portfolio, with InfraRisk scores benchmarked against the continental US, hazard exposure decomposed across 11 hazard types, and red-flag detection per asset.
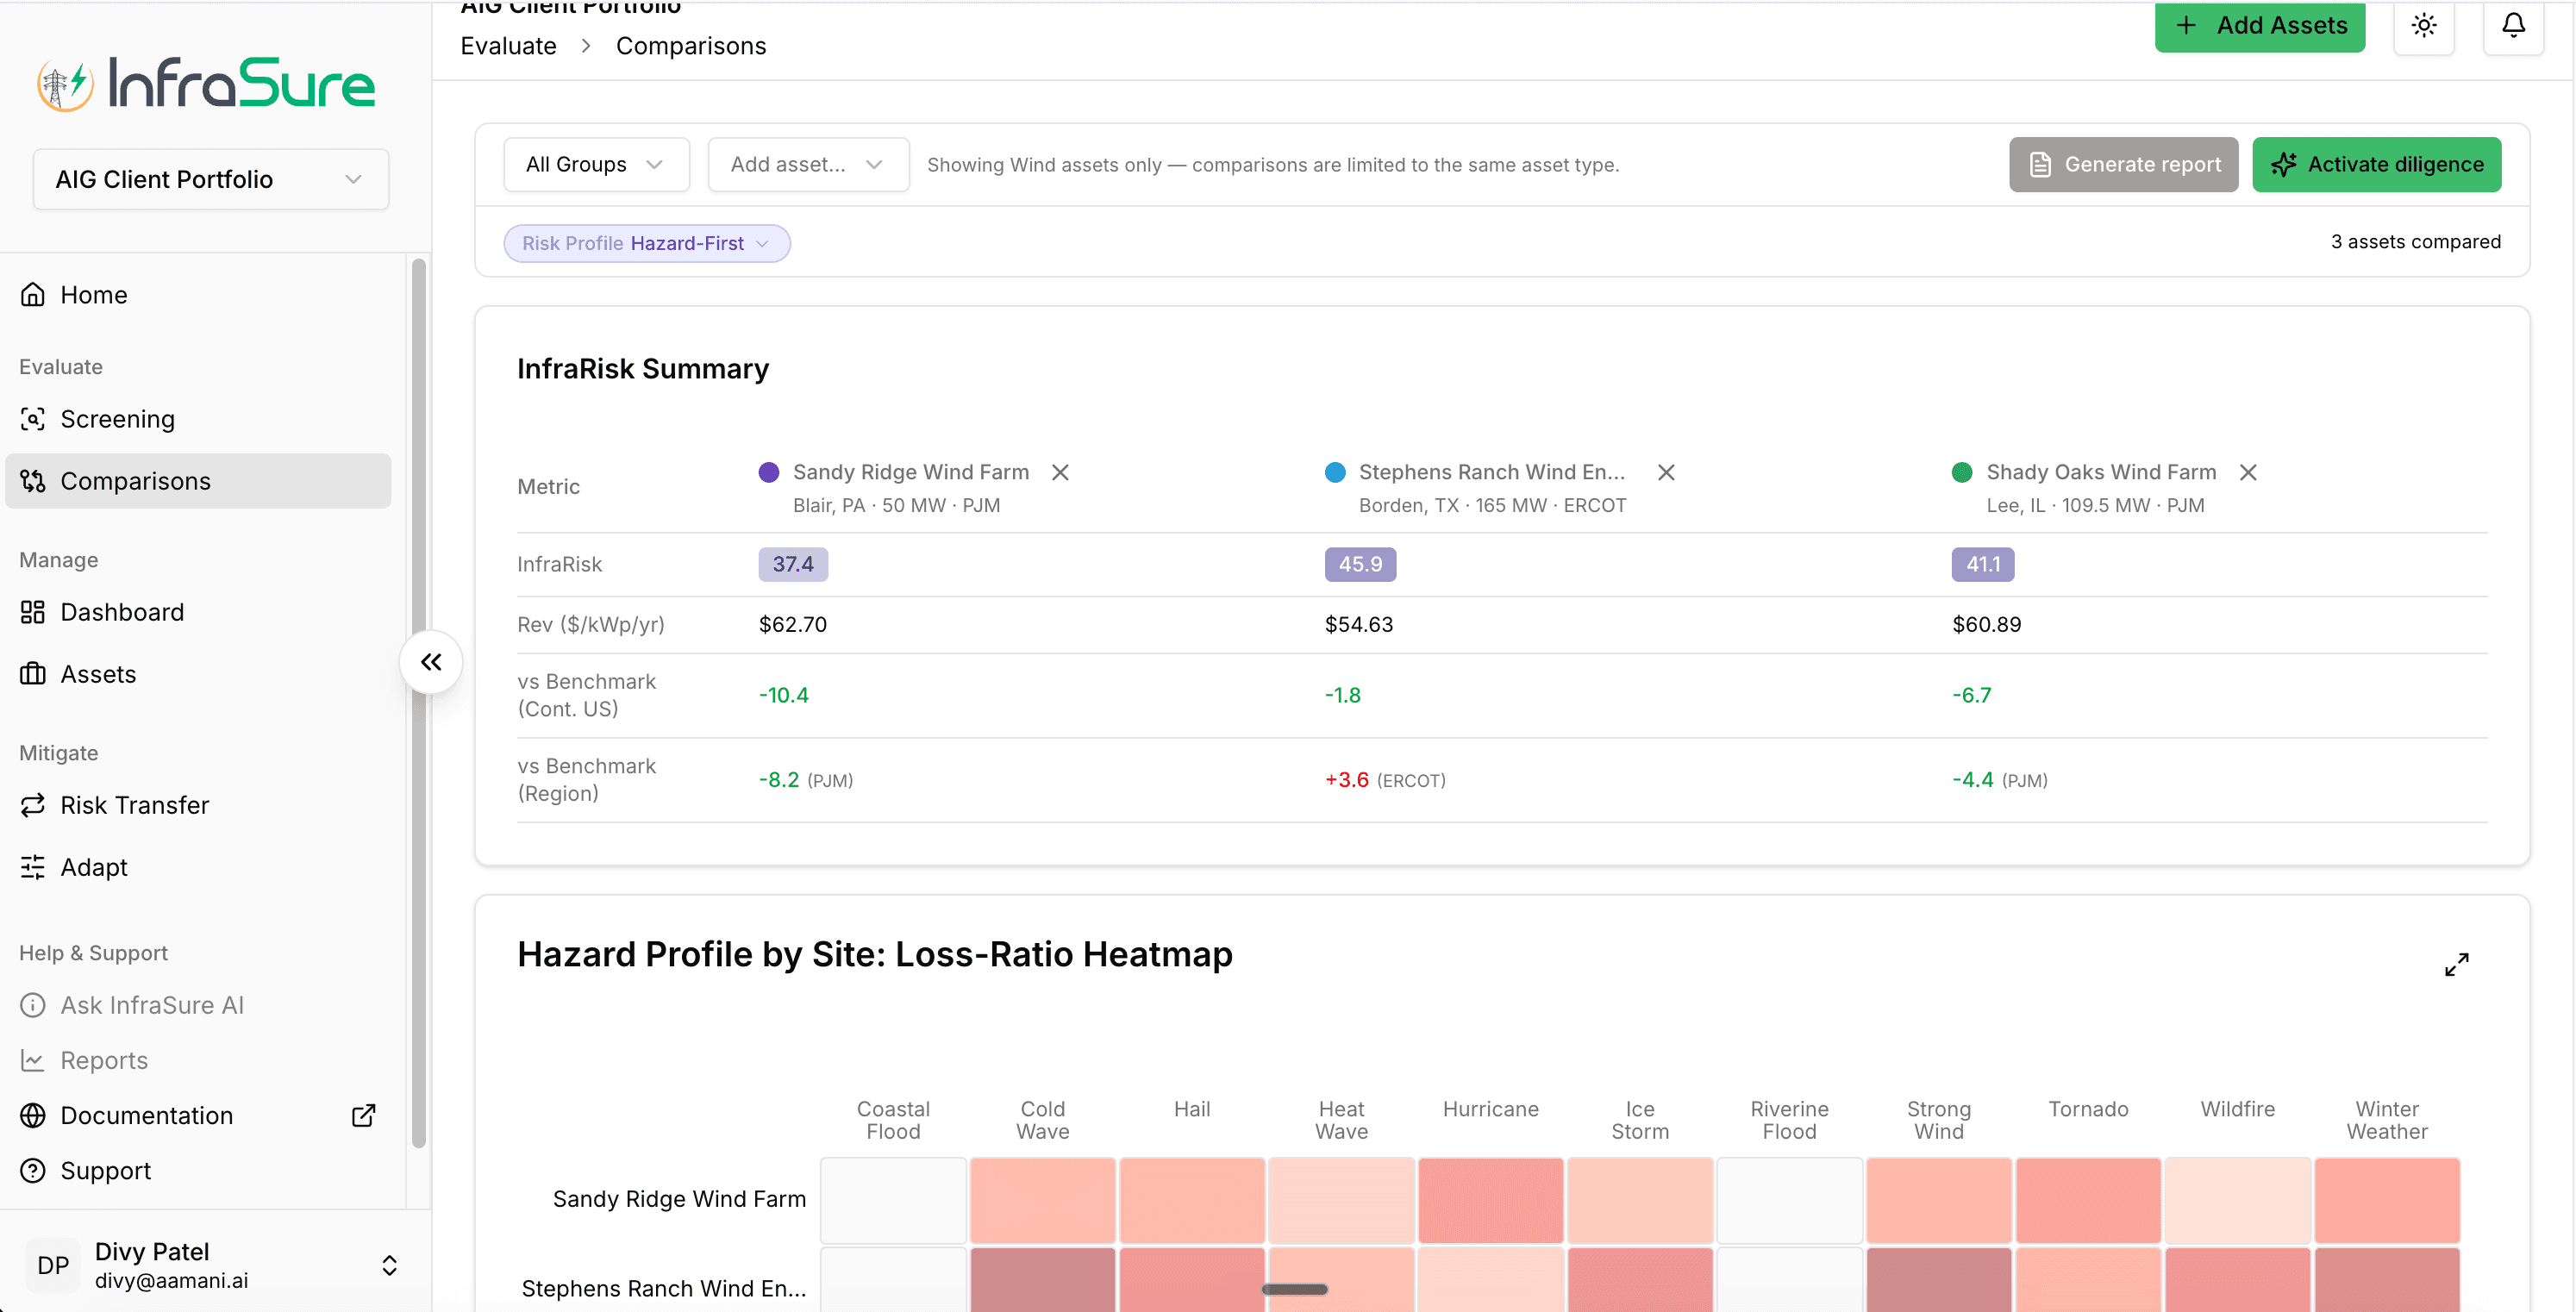
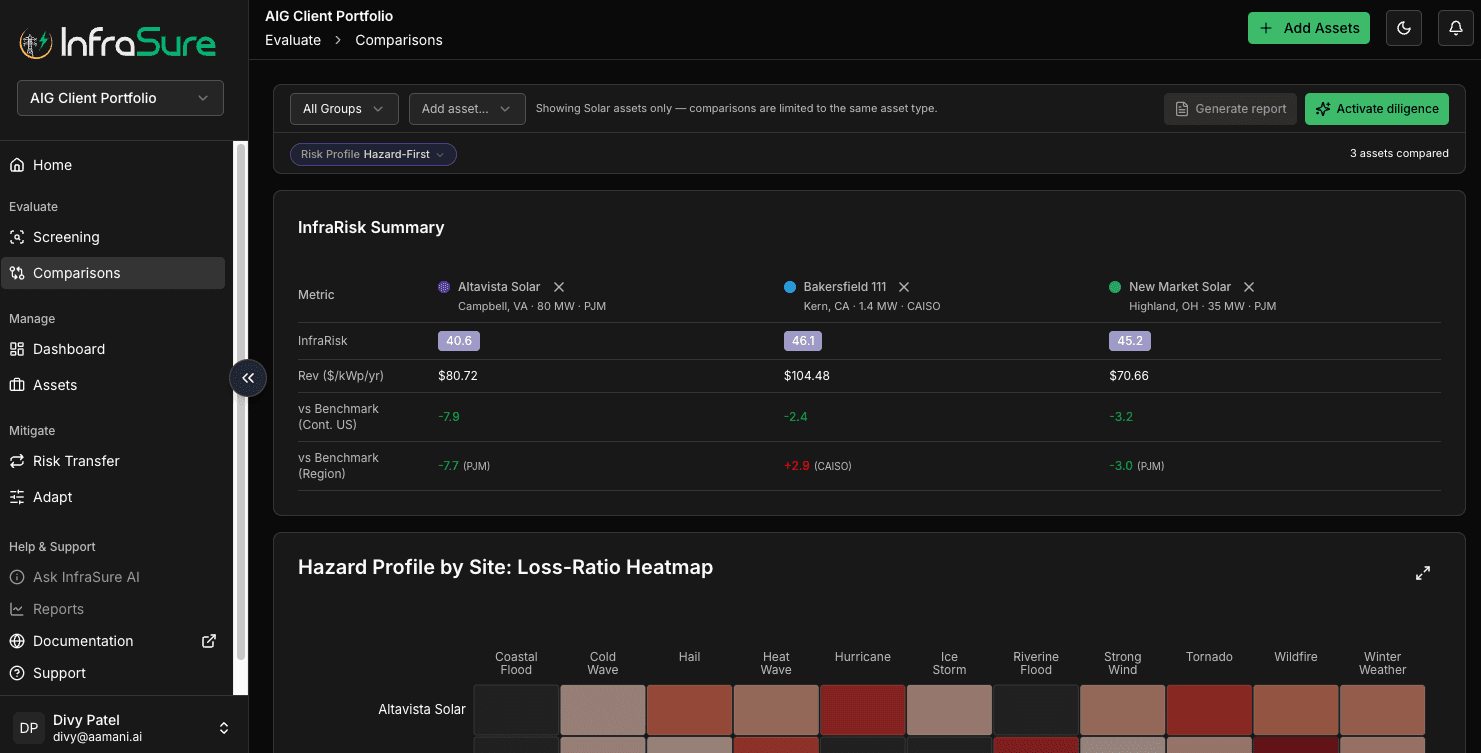
Evaluate / Comparisons view — InfraRisk summary comparing three solar assets (Great Bay Solar 1, Altavista Solar, Bakersfield 111) on score, revenue per kWp, and benchmark deltas against continental US and regional peers; below, a hazard loss-ratio heatmap across 11 hazard types per asset.
Side-by-side asset comparison: InfraRisk scores, benchmark-relative revenue per kWp, and per-hazard loss-ratio heatmap across 11 hazard types.
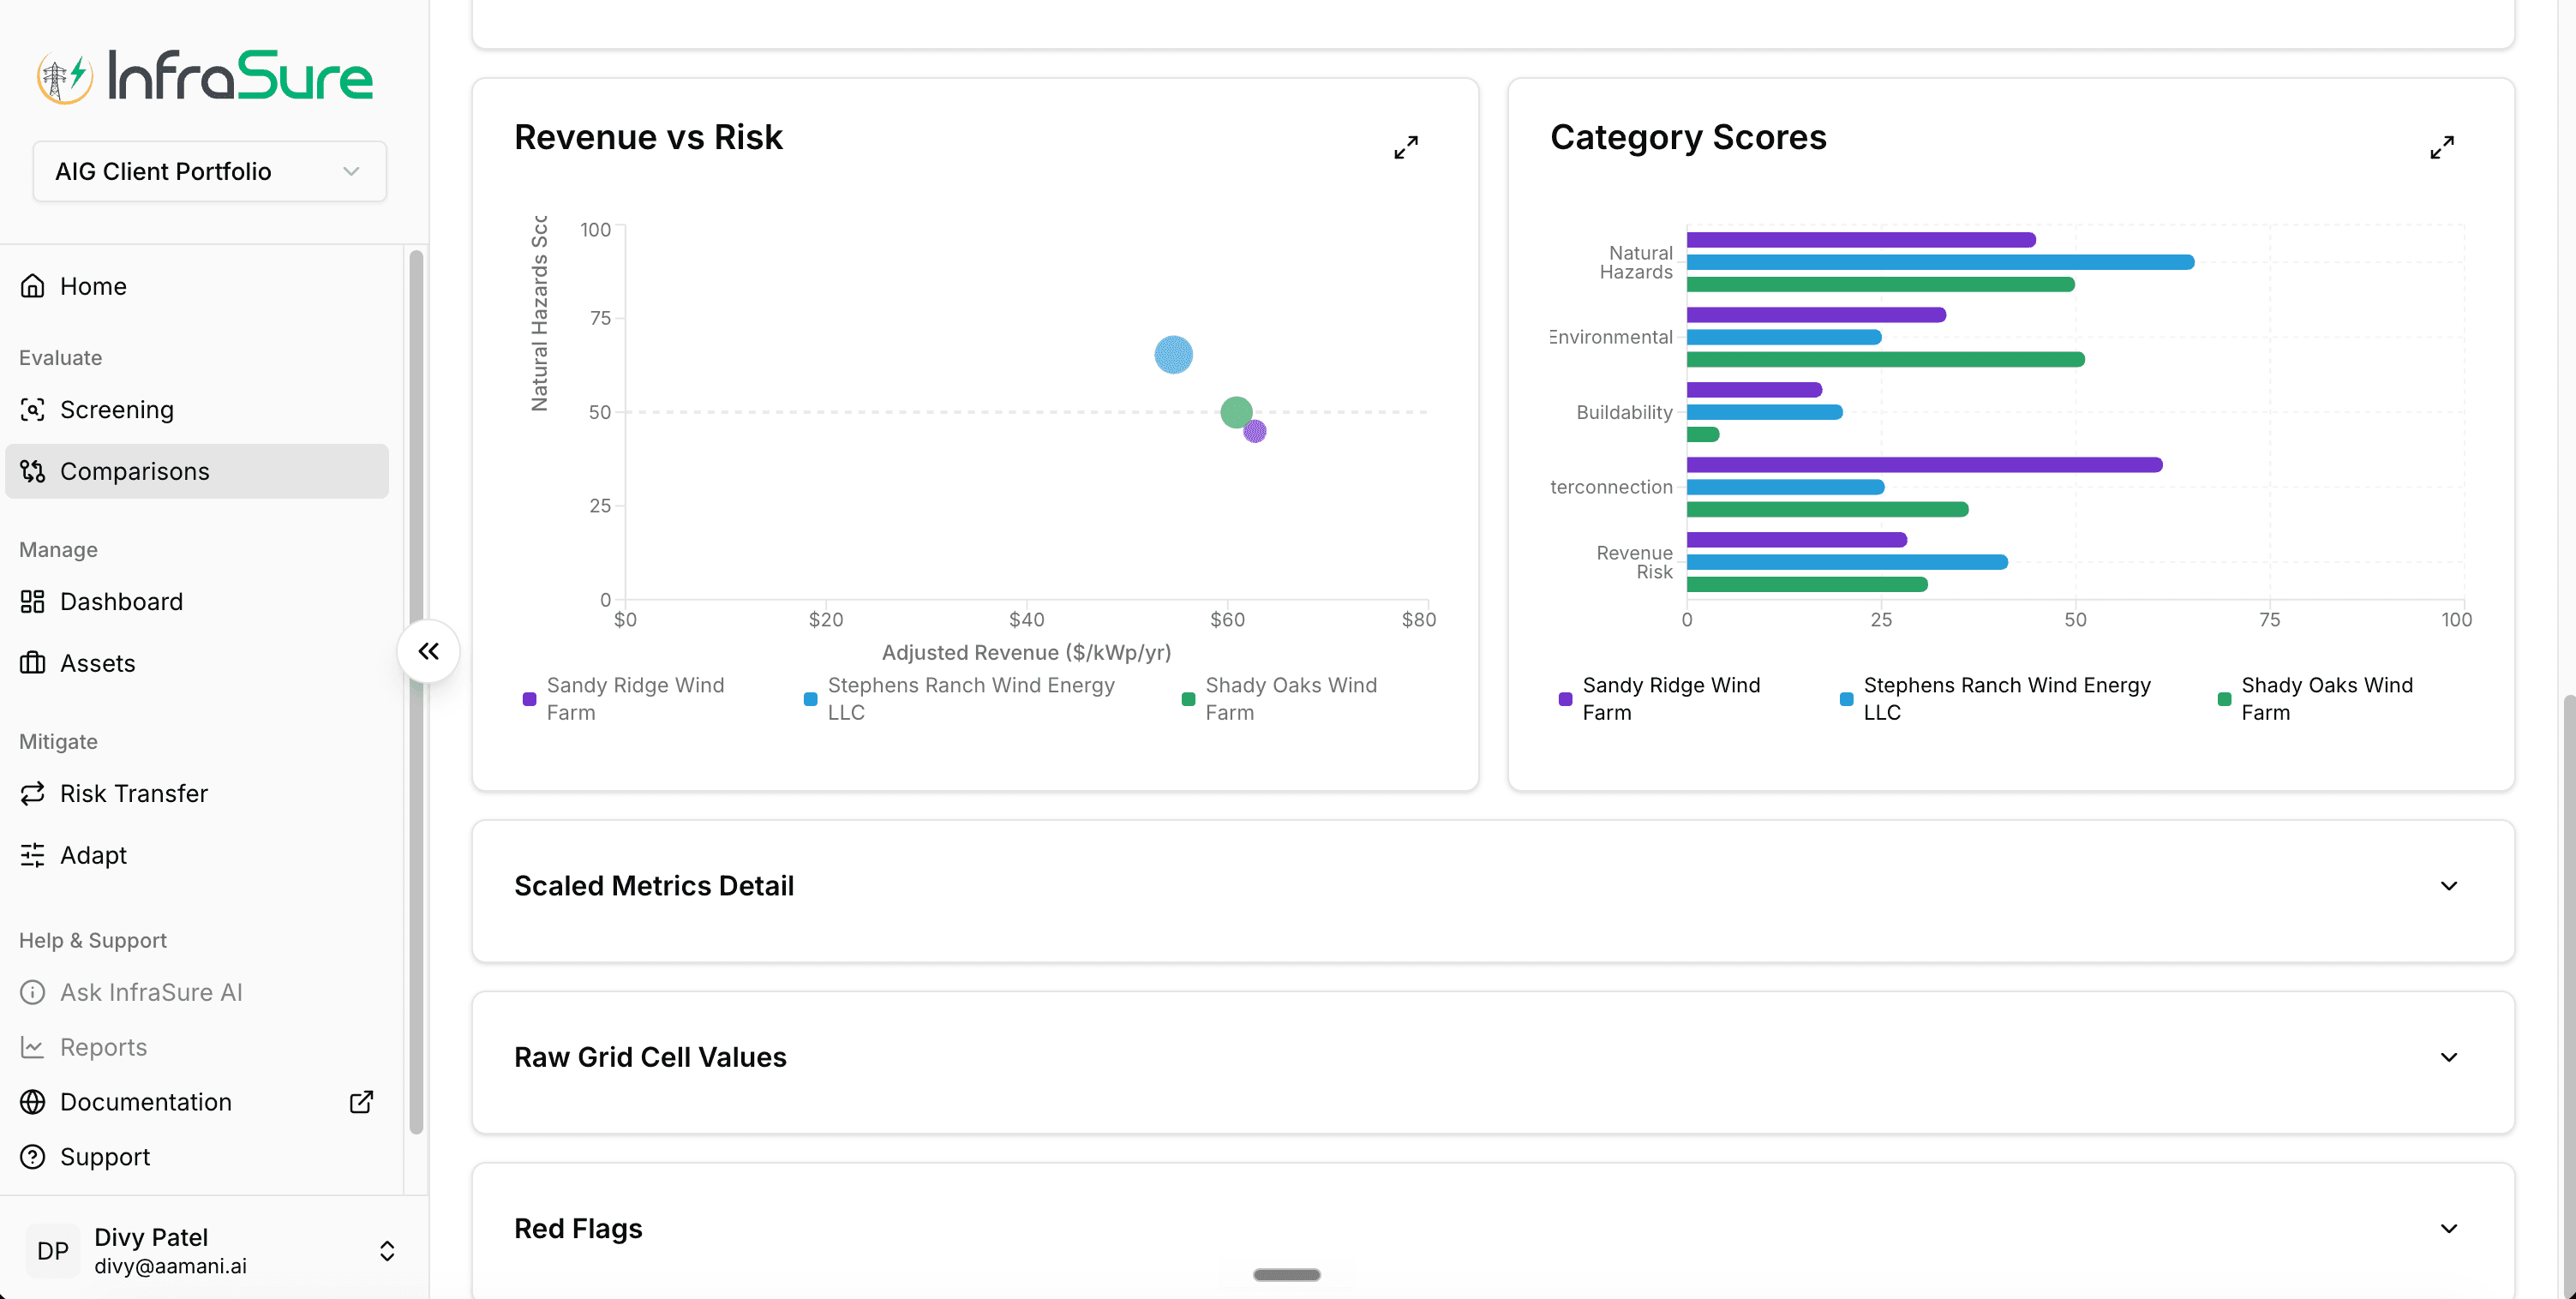
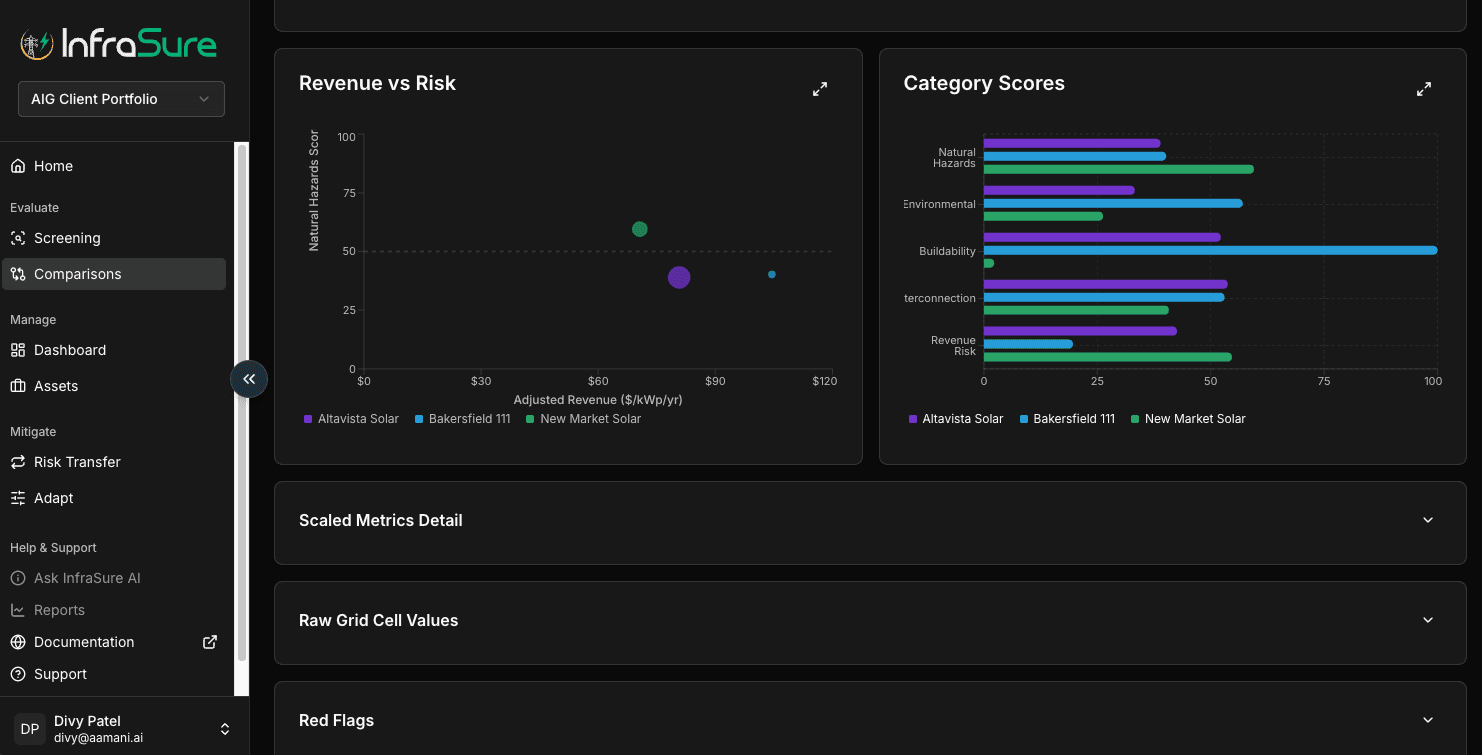
Evaluate / Comparisons view — Revenue vs Risk scatter plot positioning three assets on Natural Hazards Score versus Adjusted Revenue per kWp, alongside a Category Scores horizontal bar chart breaking each asset's score across Natural Hazards, Environmental, Buildability, Interconnection, and Revenue Risk dimensions.
Revenue-vs-risk scatter and category-score breakdown — surfaces which dimensions drive each asset's standing relative to the others.
Side-by-side asset comparisons across hazard types and revenue performance metrics
Revenue-vs-risk comparisons surfacing asset strengths and weaknesses
InfraRisk scoring benchmarked against continental, regional, or custom peer sets
Red-flag identification and analysis
Hazard loss-ratio heatmaps
Geospatial (down-scaled) drivers of hazard and asset evaluation

The output is not a recommendation. It's a prioritization — which assets in the set deserve the underwriting time you do not have to spare.

2Workflow 2 of 3

Manage

Underwrite + Structure

When a specific asset matters, Manage is the workflow that earns the depth. The position you defend in front of an investment committee — not a score.
2.1
Decompose
Asset-level hazard composition: EAL, VaR, PML decomposed by hazard and return period.
2.2
Forecast
Probabilistic generation and revenue paths against covenant thresholds.
2.3
Defend
Identify coverage gaps by hazard + configurable scenarios.
app.infrasure.ai
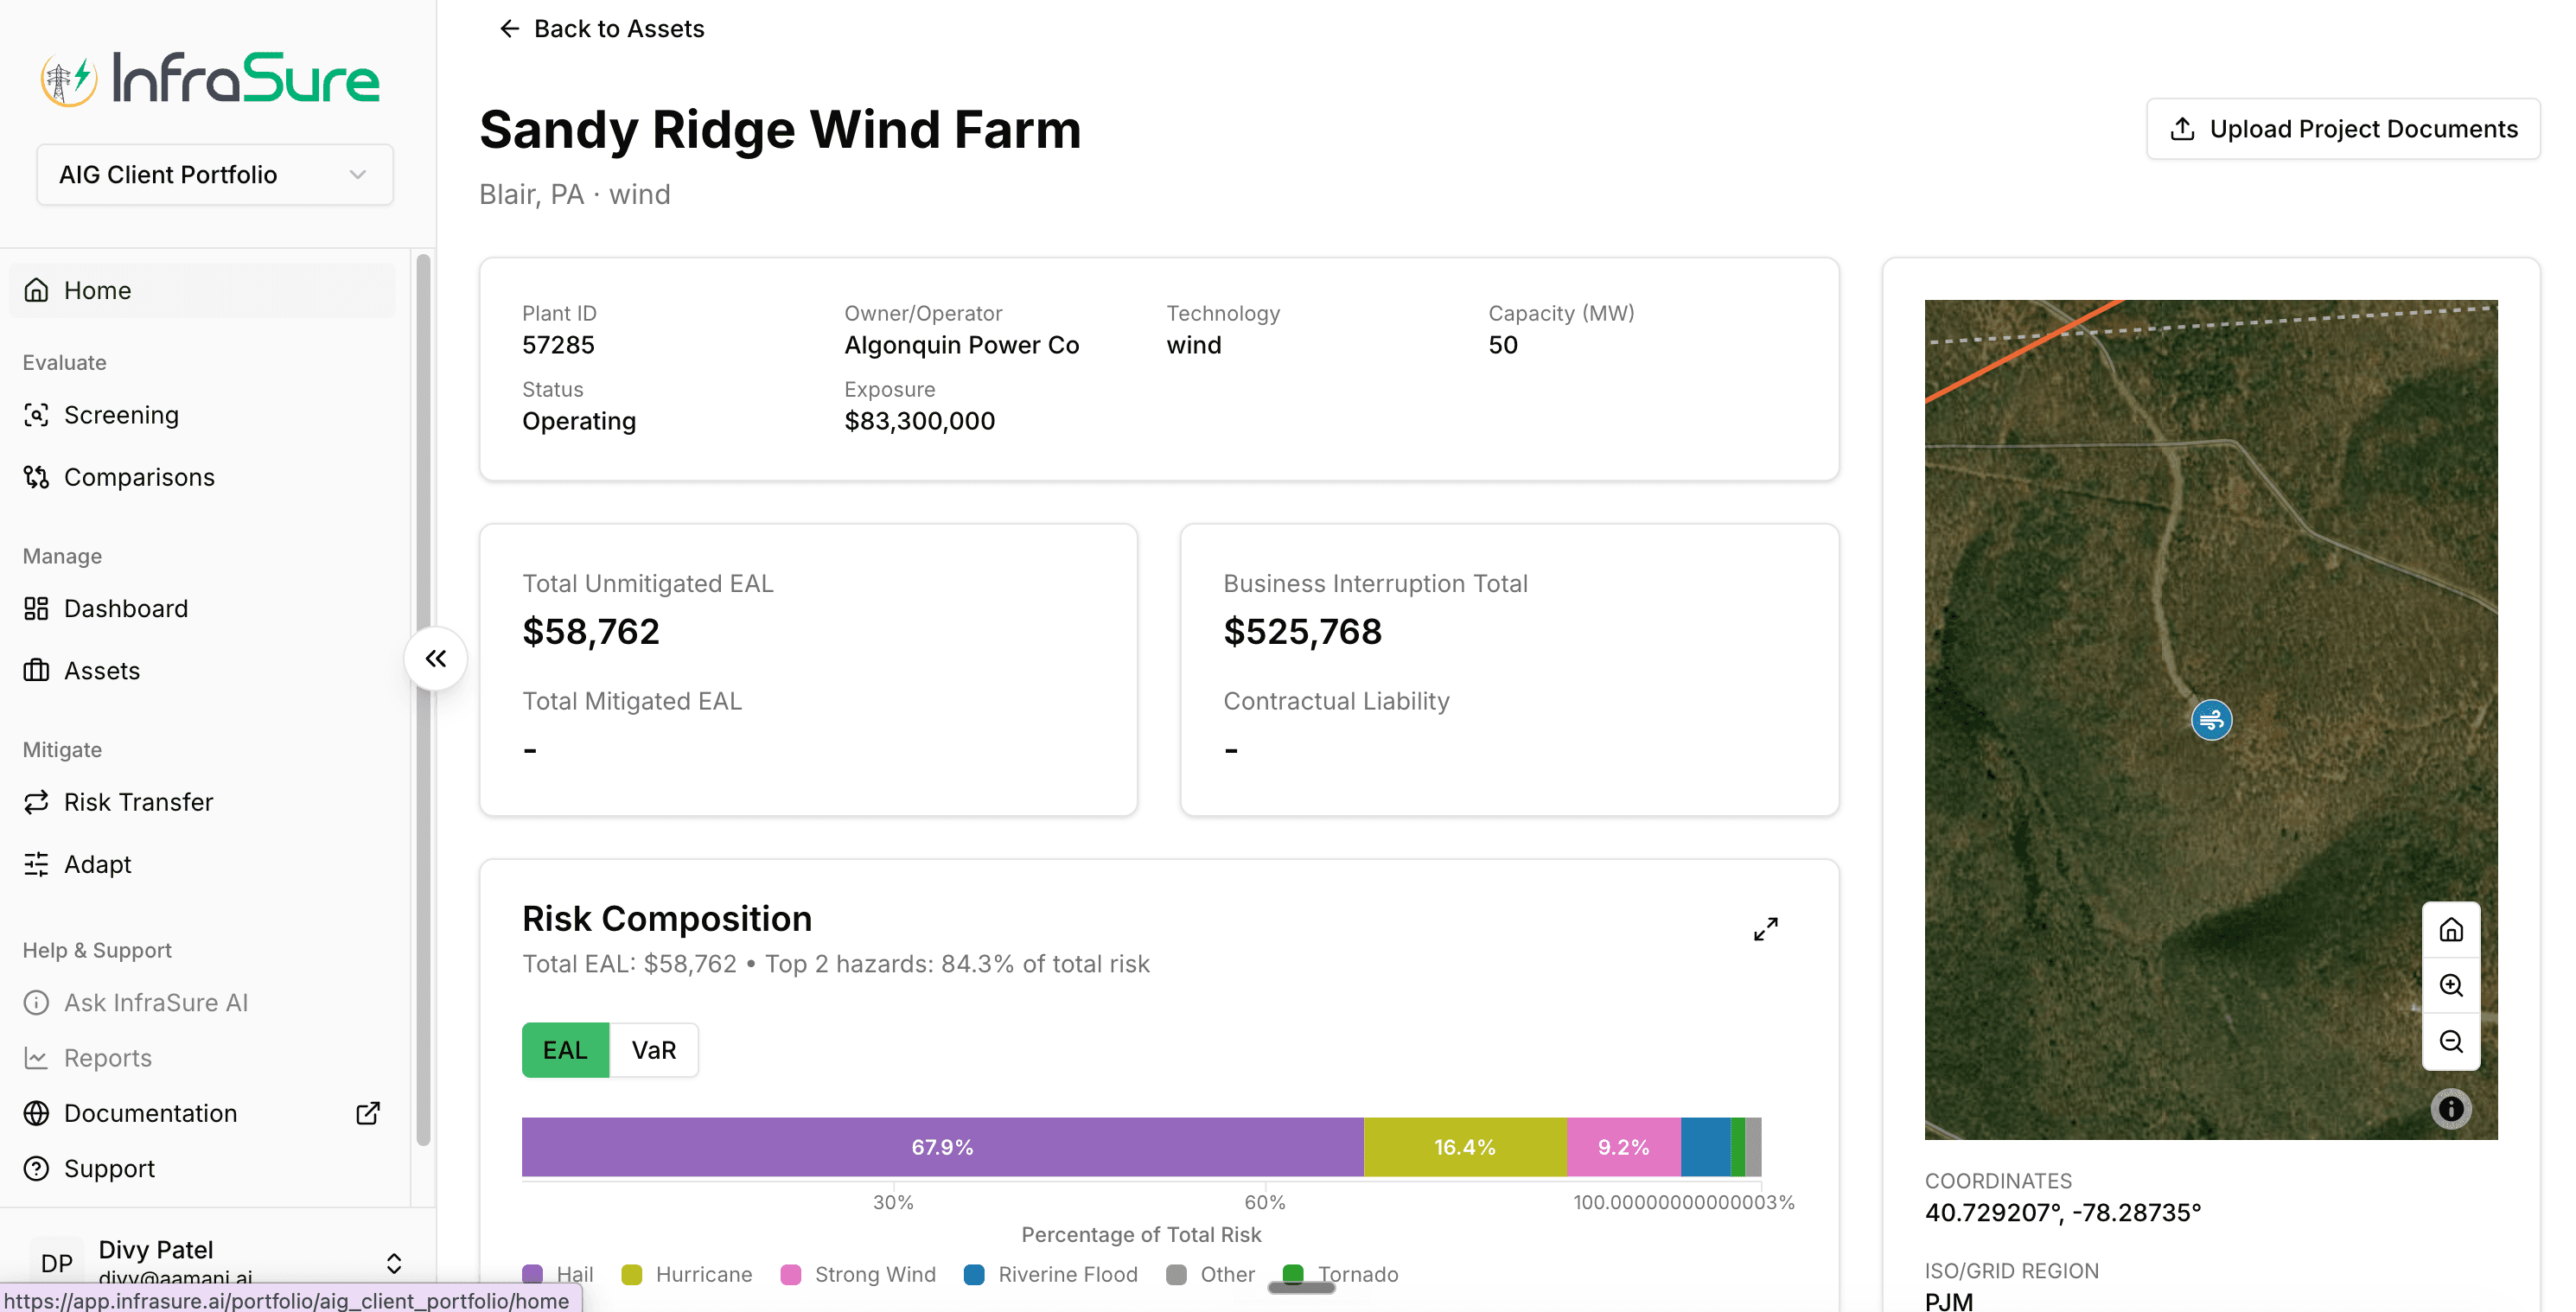
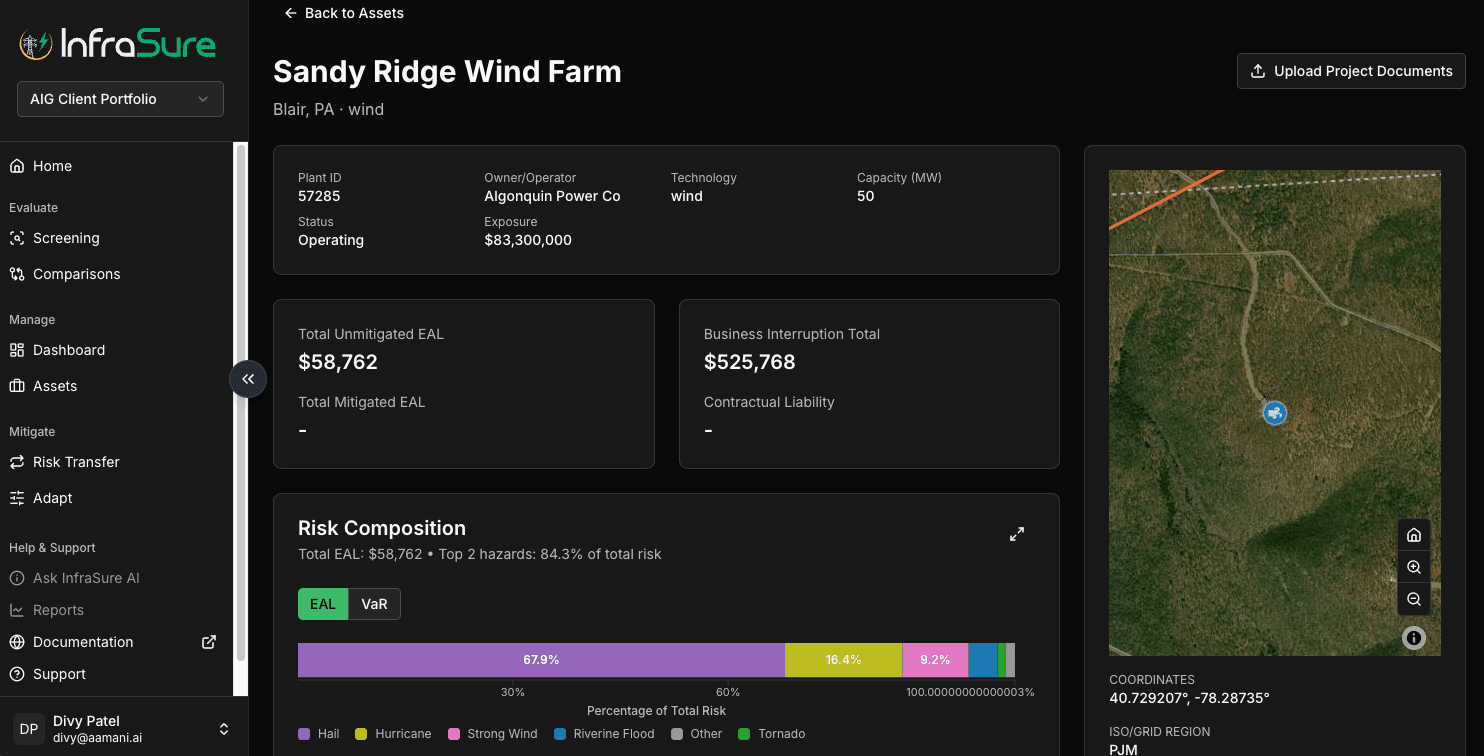
Sandy Ridge Wind Farm risk composition — total unmitigated EAL $58,762 with risk decomposed across hail (67.9%), hurricane (16.4%), strong wind (9.2%), and secondaries.
Identify key hazards and calibrate risk within entire asset composition.
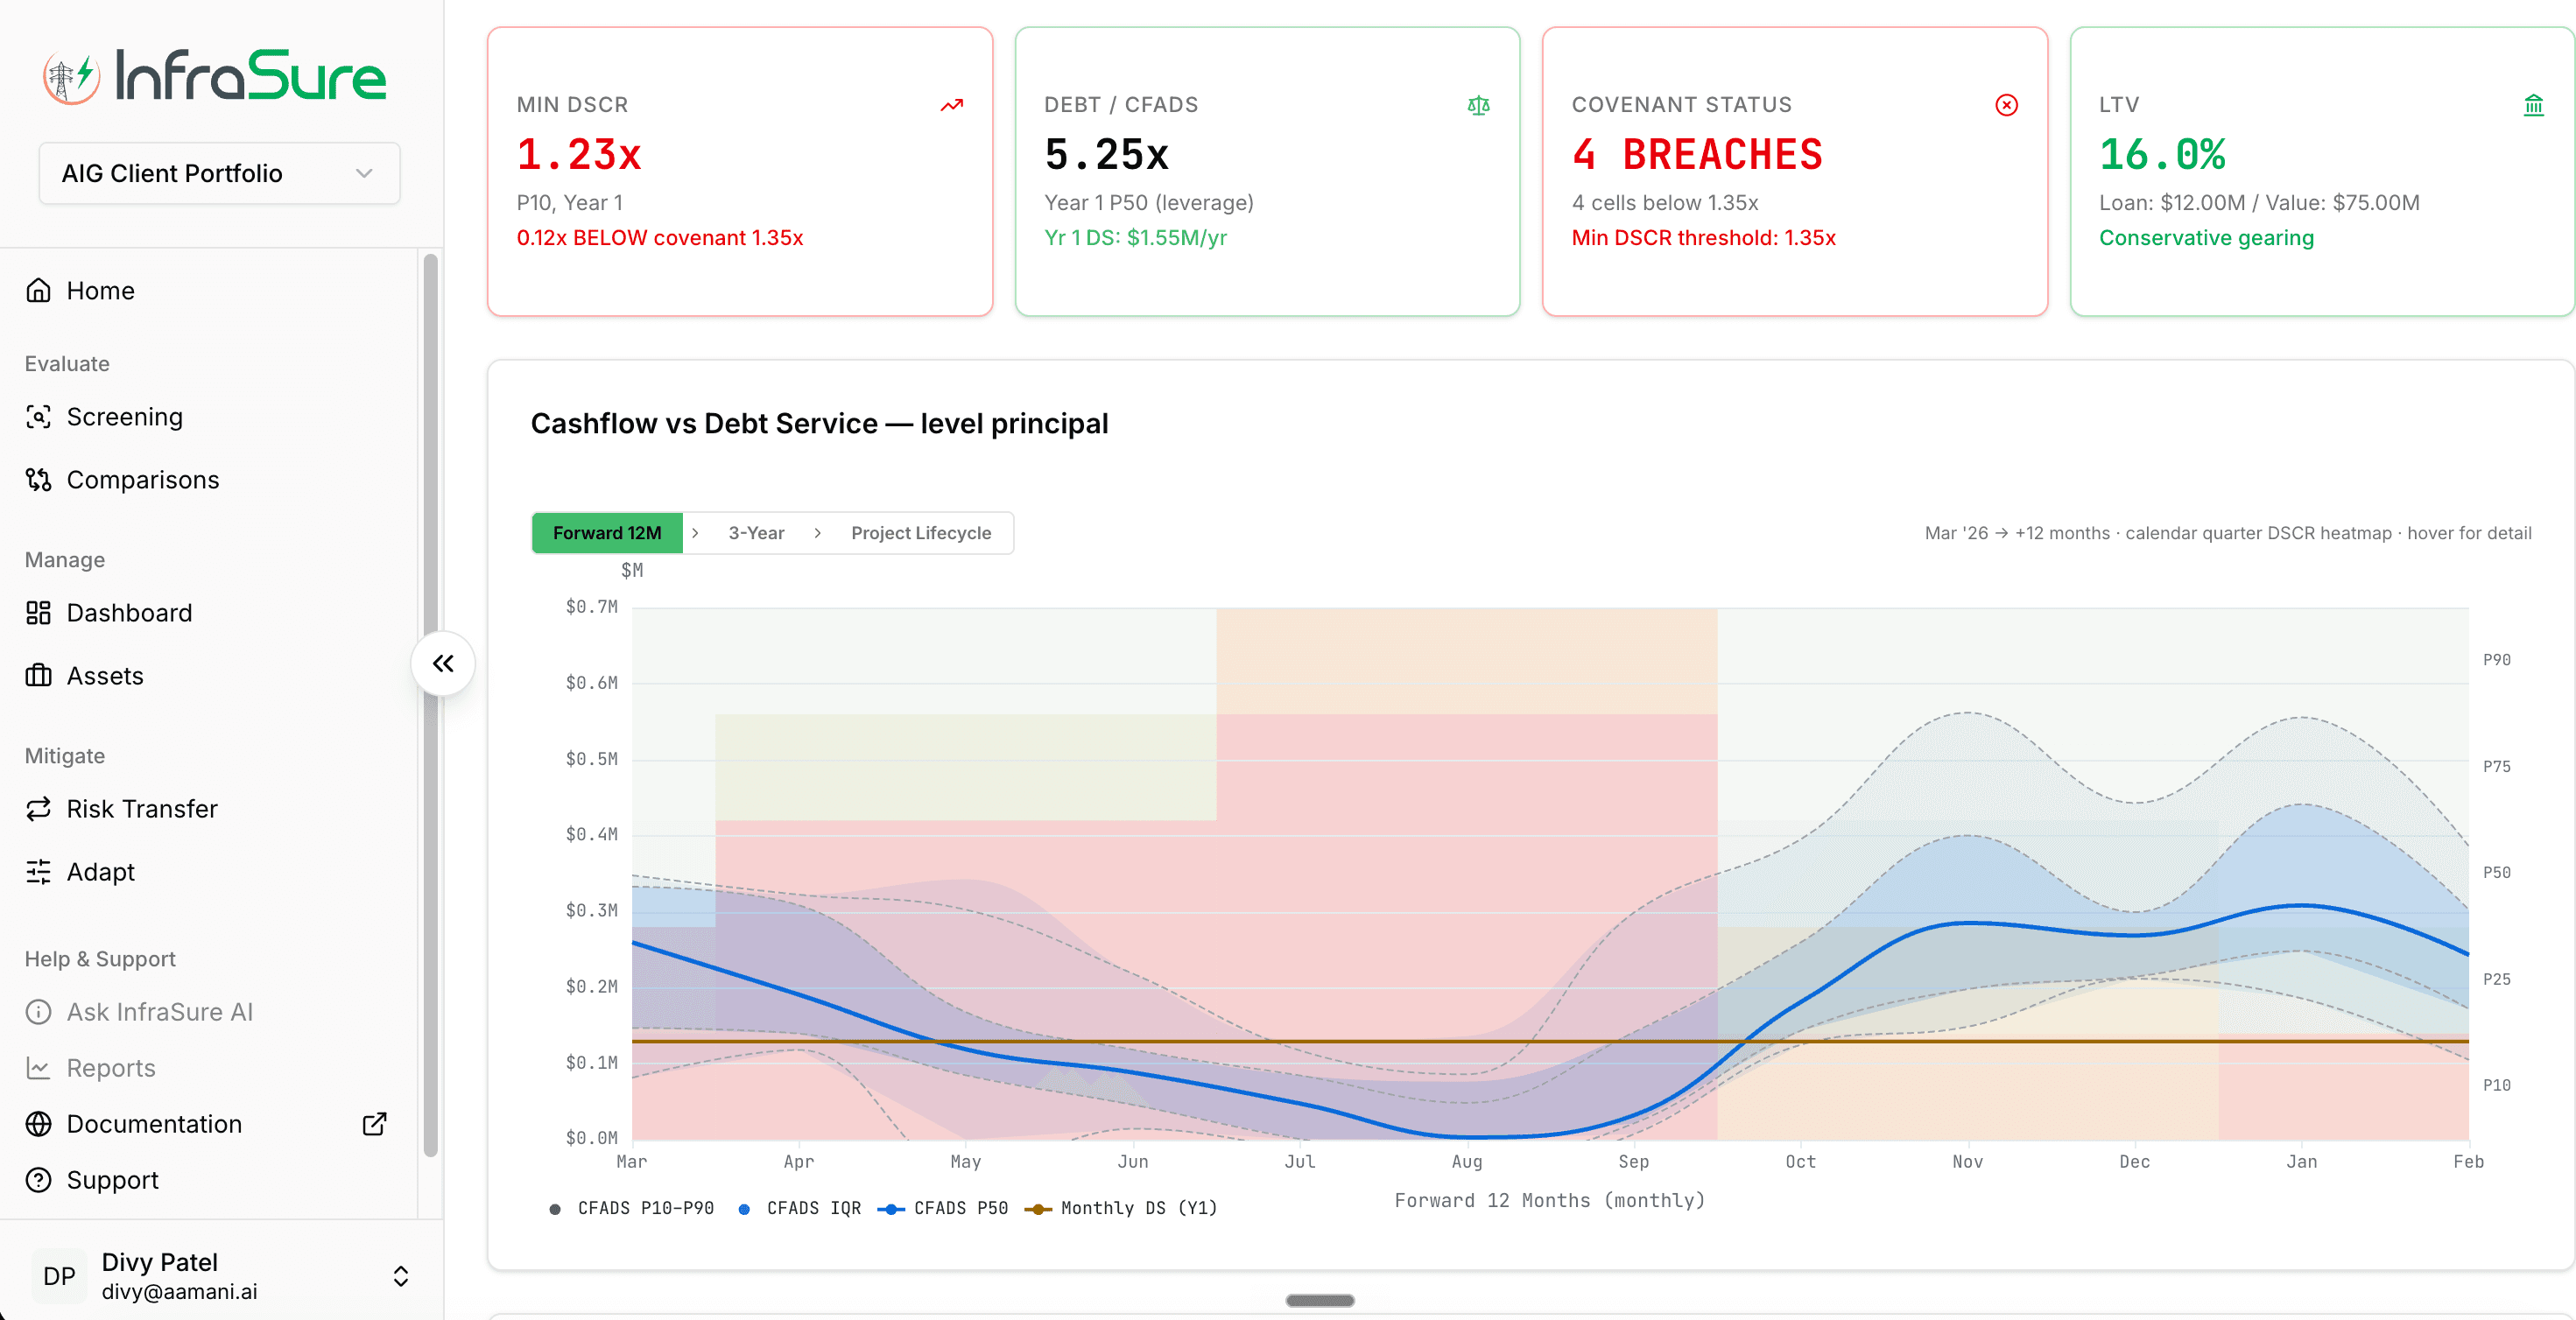
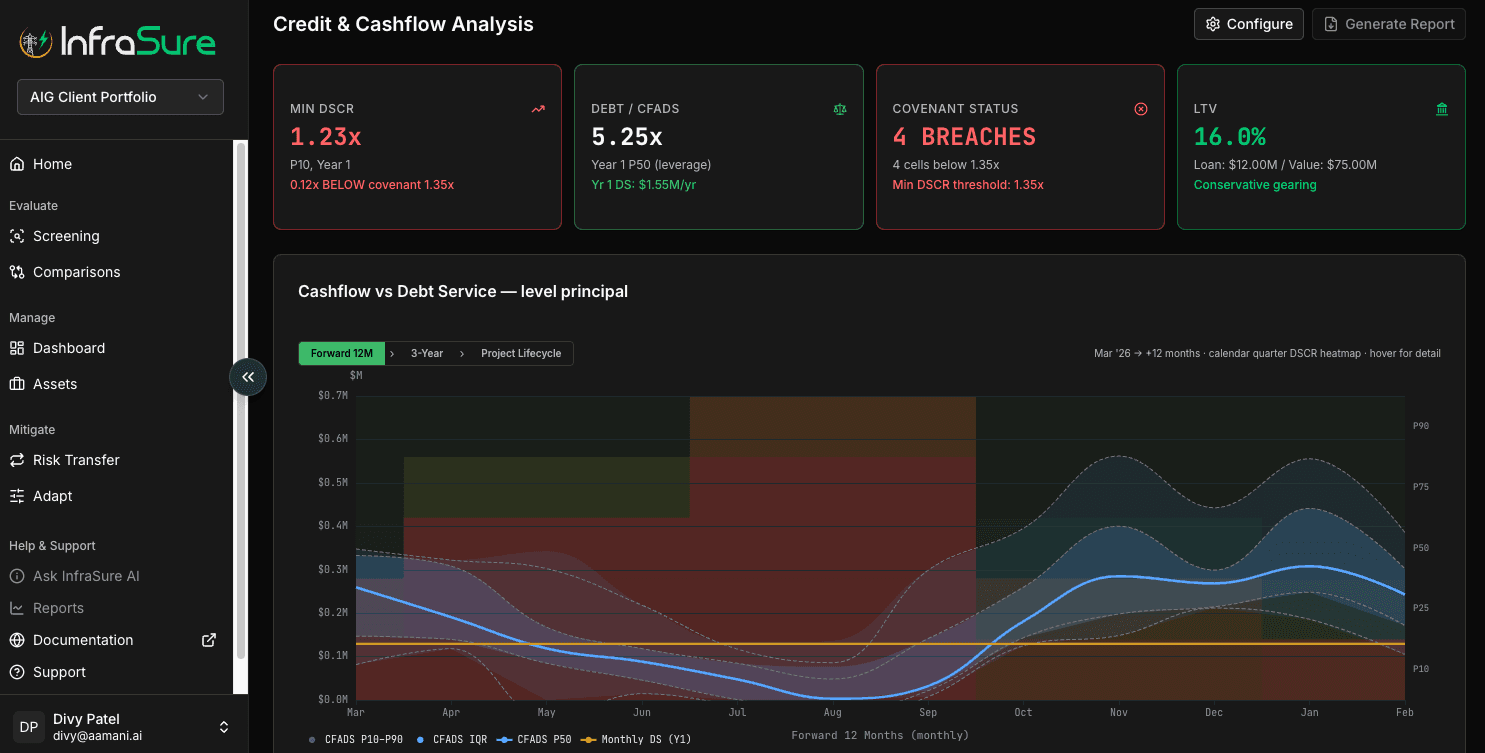
Cashflow vs debt service chart — CFADS P10-P90 bands plotted against monthly debt service over a forward 12-month horizon.
Probabilistic CFADS forecast against debt service. Minimum P10 DSCR of 1.23x against a 1.35x covenant.
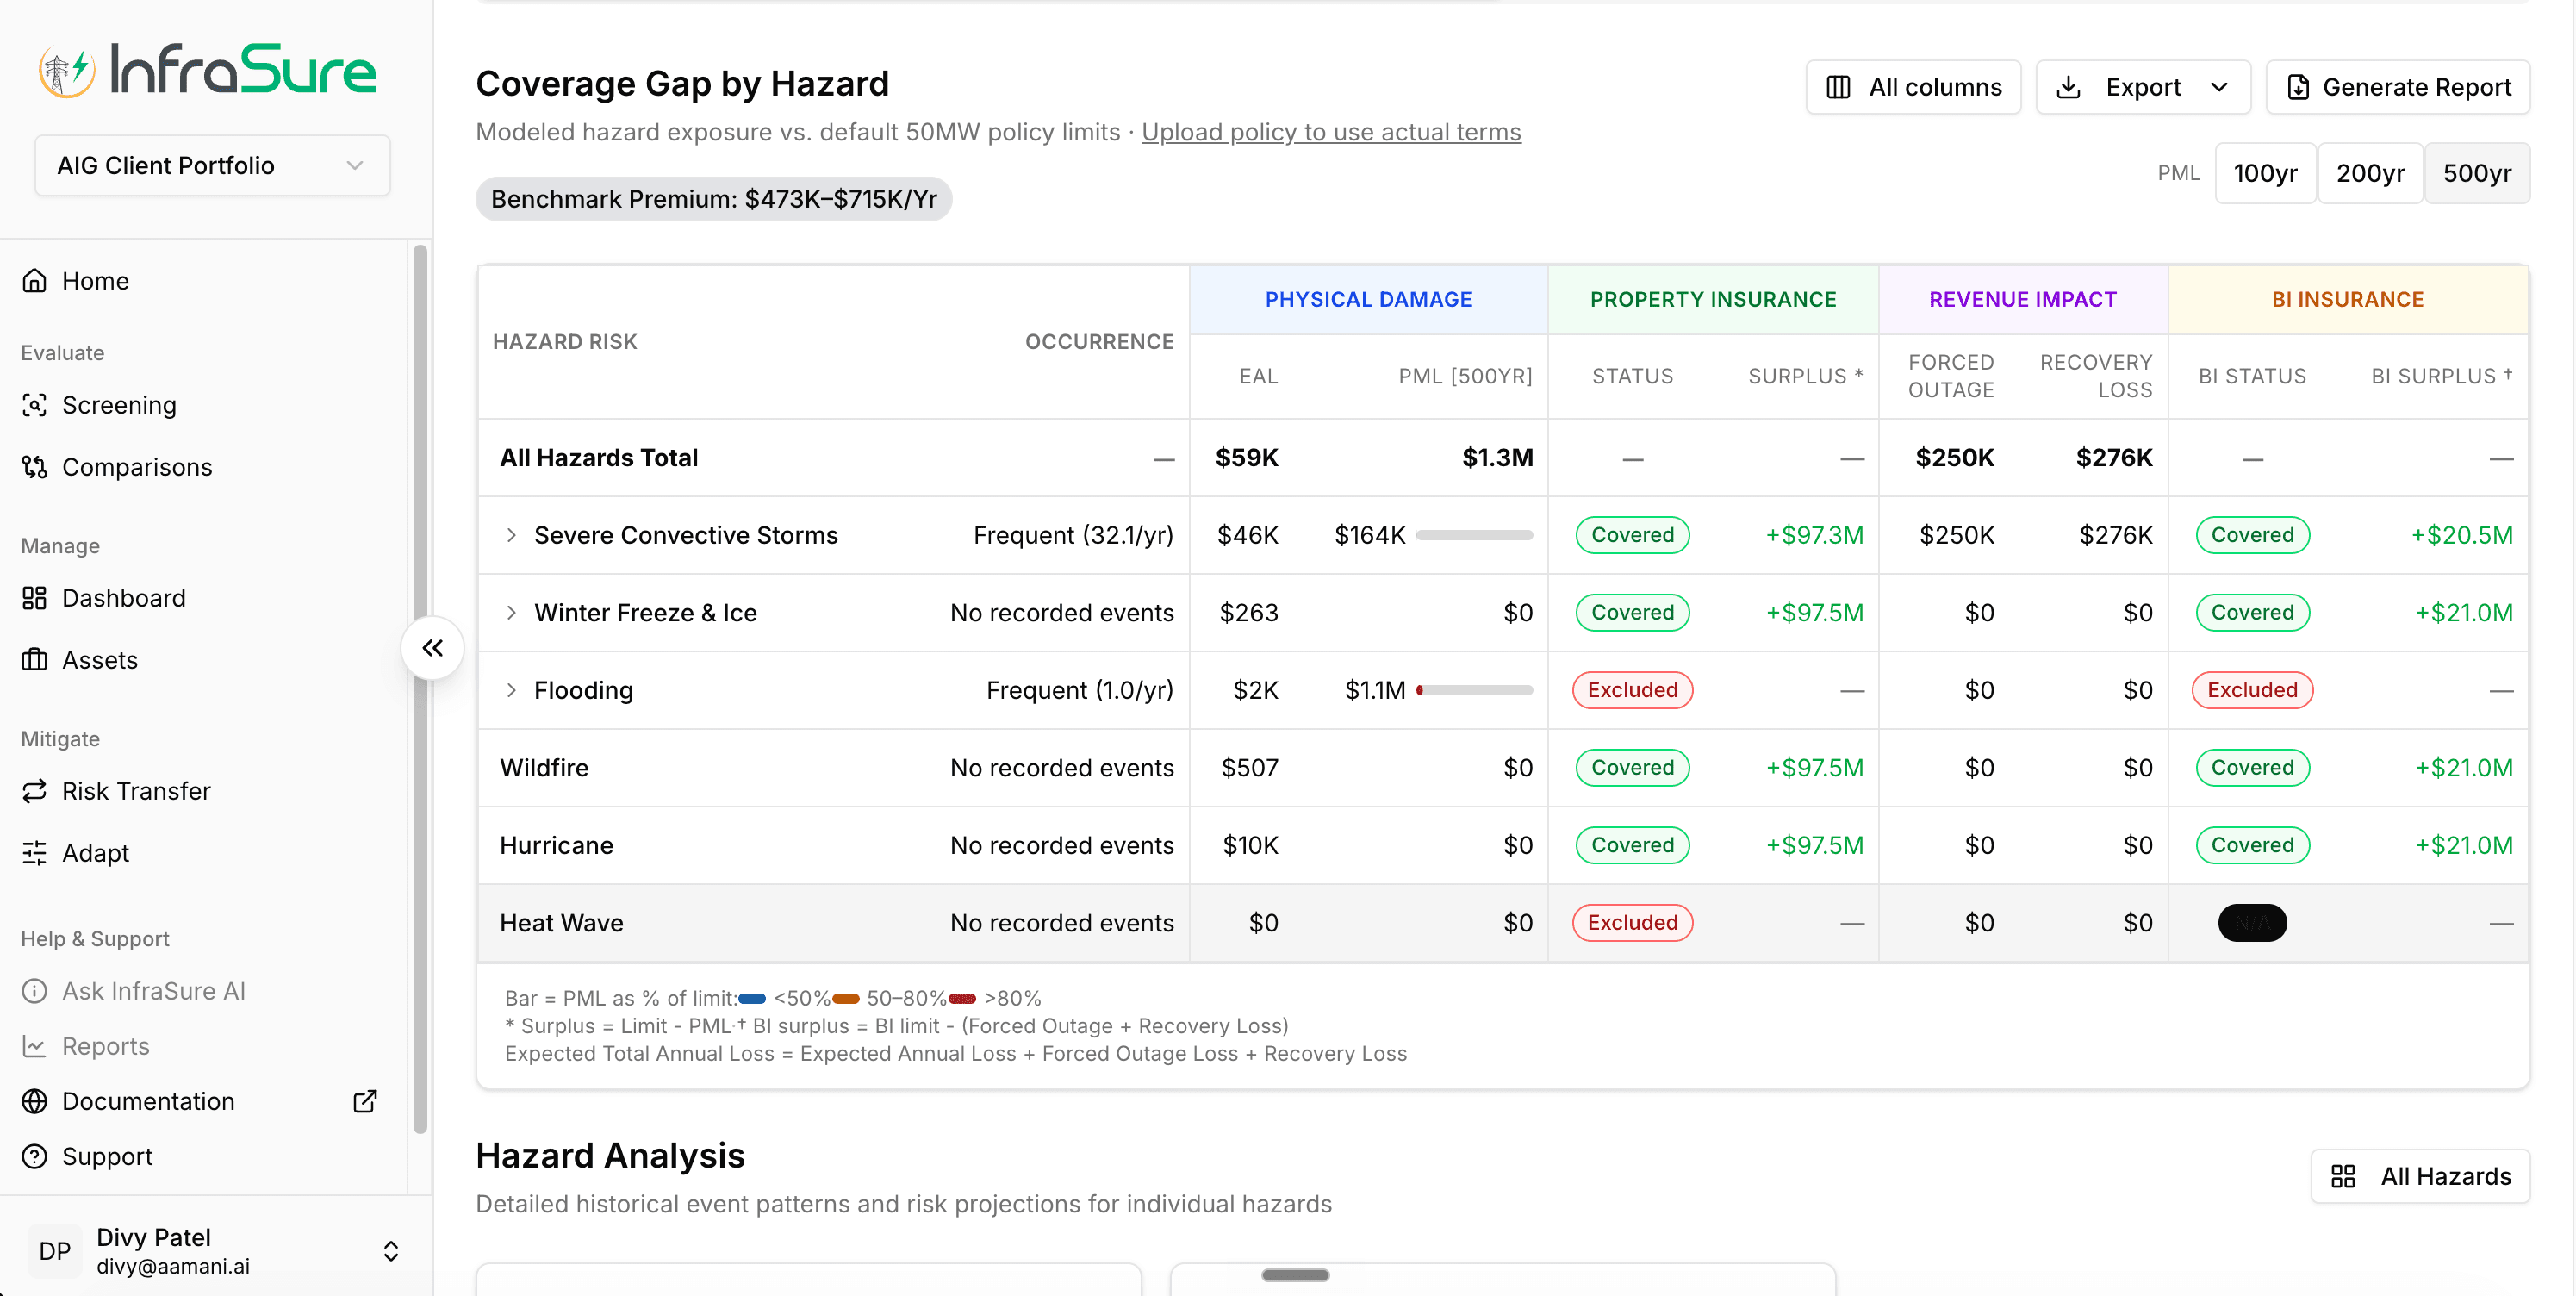
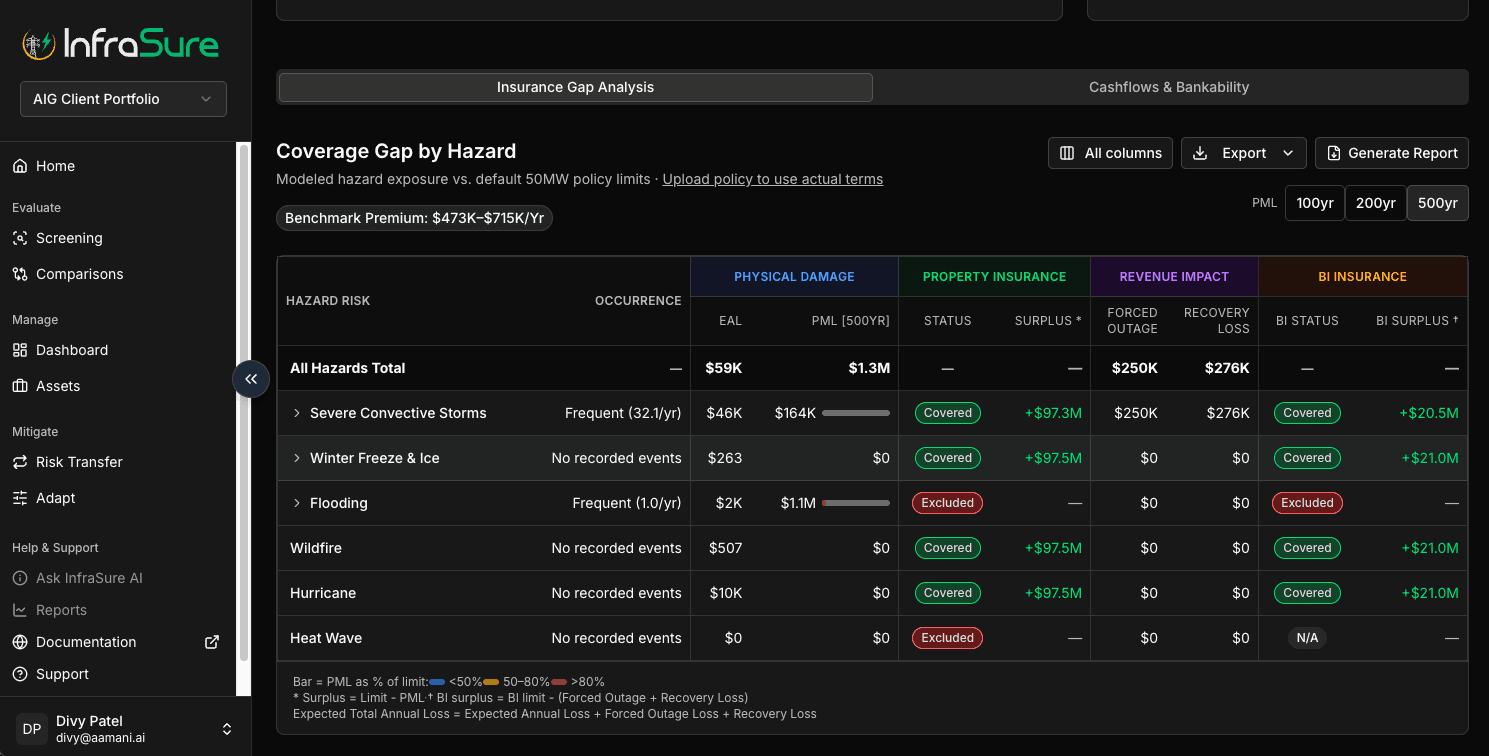
Coverage Gap by Hazard table comparing modeled hazard exposure to actual policy terms.
Coverage gap analysis: physical damage and revenue impact gaps surfaced per hazard at 500-year PML.
Hazard composition by asset (EAL / VaR / PML at 100yr, 200yr, 500yr)
Probabilistic generation forecasts (P50 / P90 / P99)
Bankability schedule with covenant stress detection
Insurance gap analysis by hazard and coverage layer
Business interruption exposure modeling
Configurable asset parameters with live re-modeling

The output is not a score. It's a position — a coherent, defensible read of the asset's economics and risk profile that the customer can act on.

3Workflow 3 of 3

Mitigate

Transfer + Adapt

Where analytical clarity becomes financial action. The same hazard distribution that drove the DSCR stress prices the parametric trigger.
3.1
Transfer
Parametric structures priced against the asset's modeled exposure.
3.2
Optimize
Coverage layers tuned to the actual hazard distribution, gap and surplus visible.
3.3
Adapt
Resilience measures ranked by EAL reduction and cost-effectiveness.
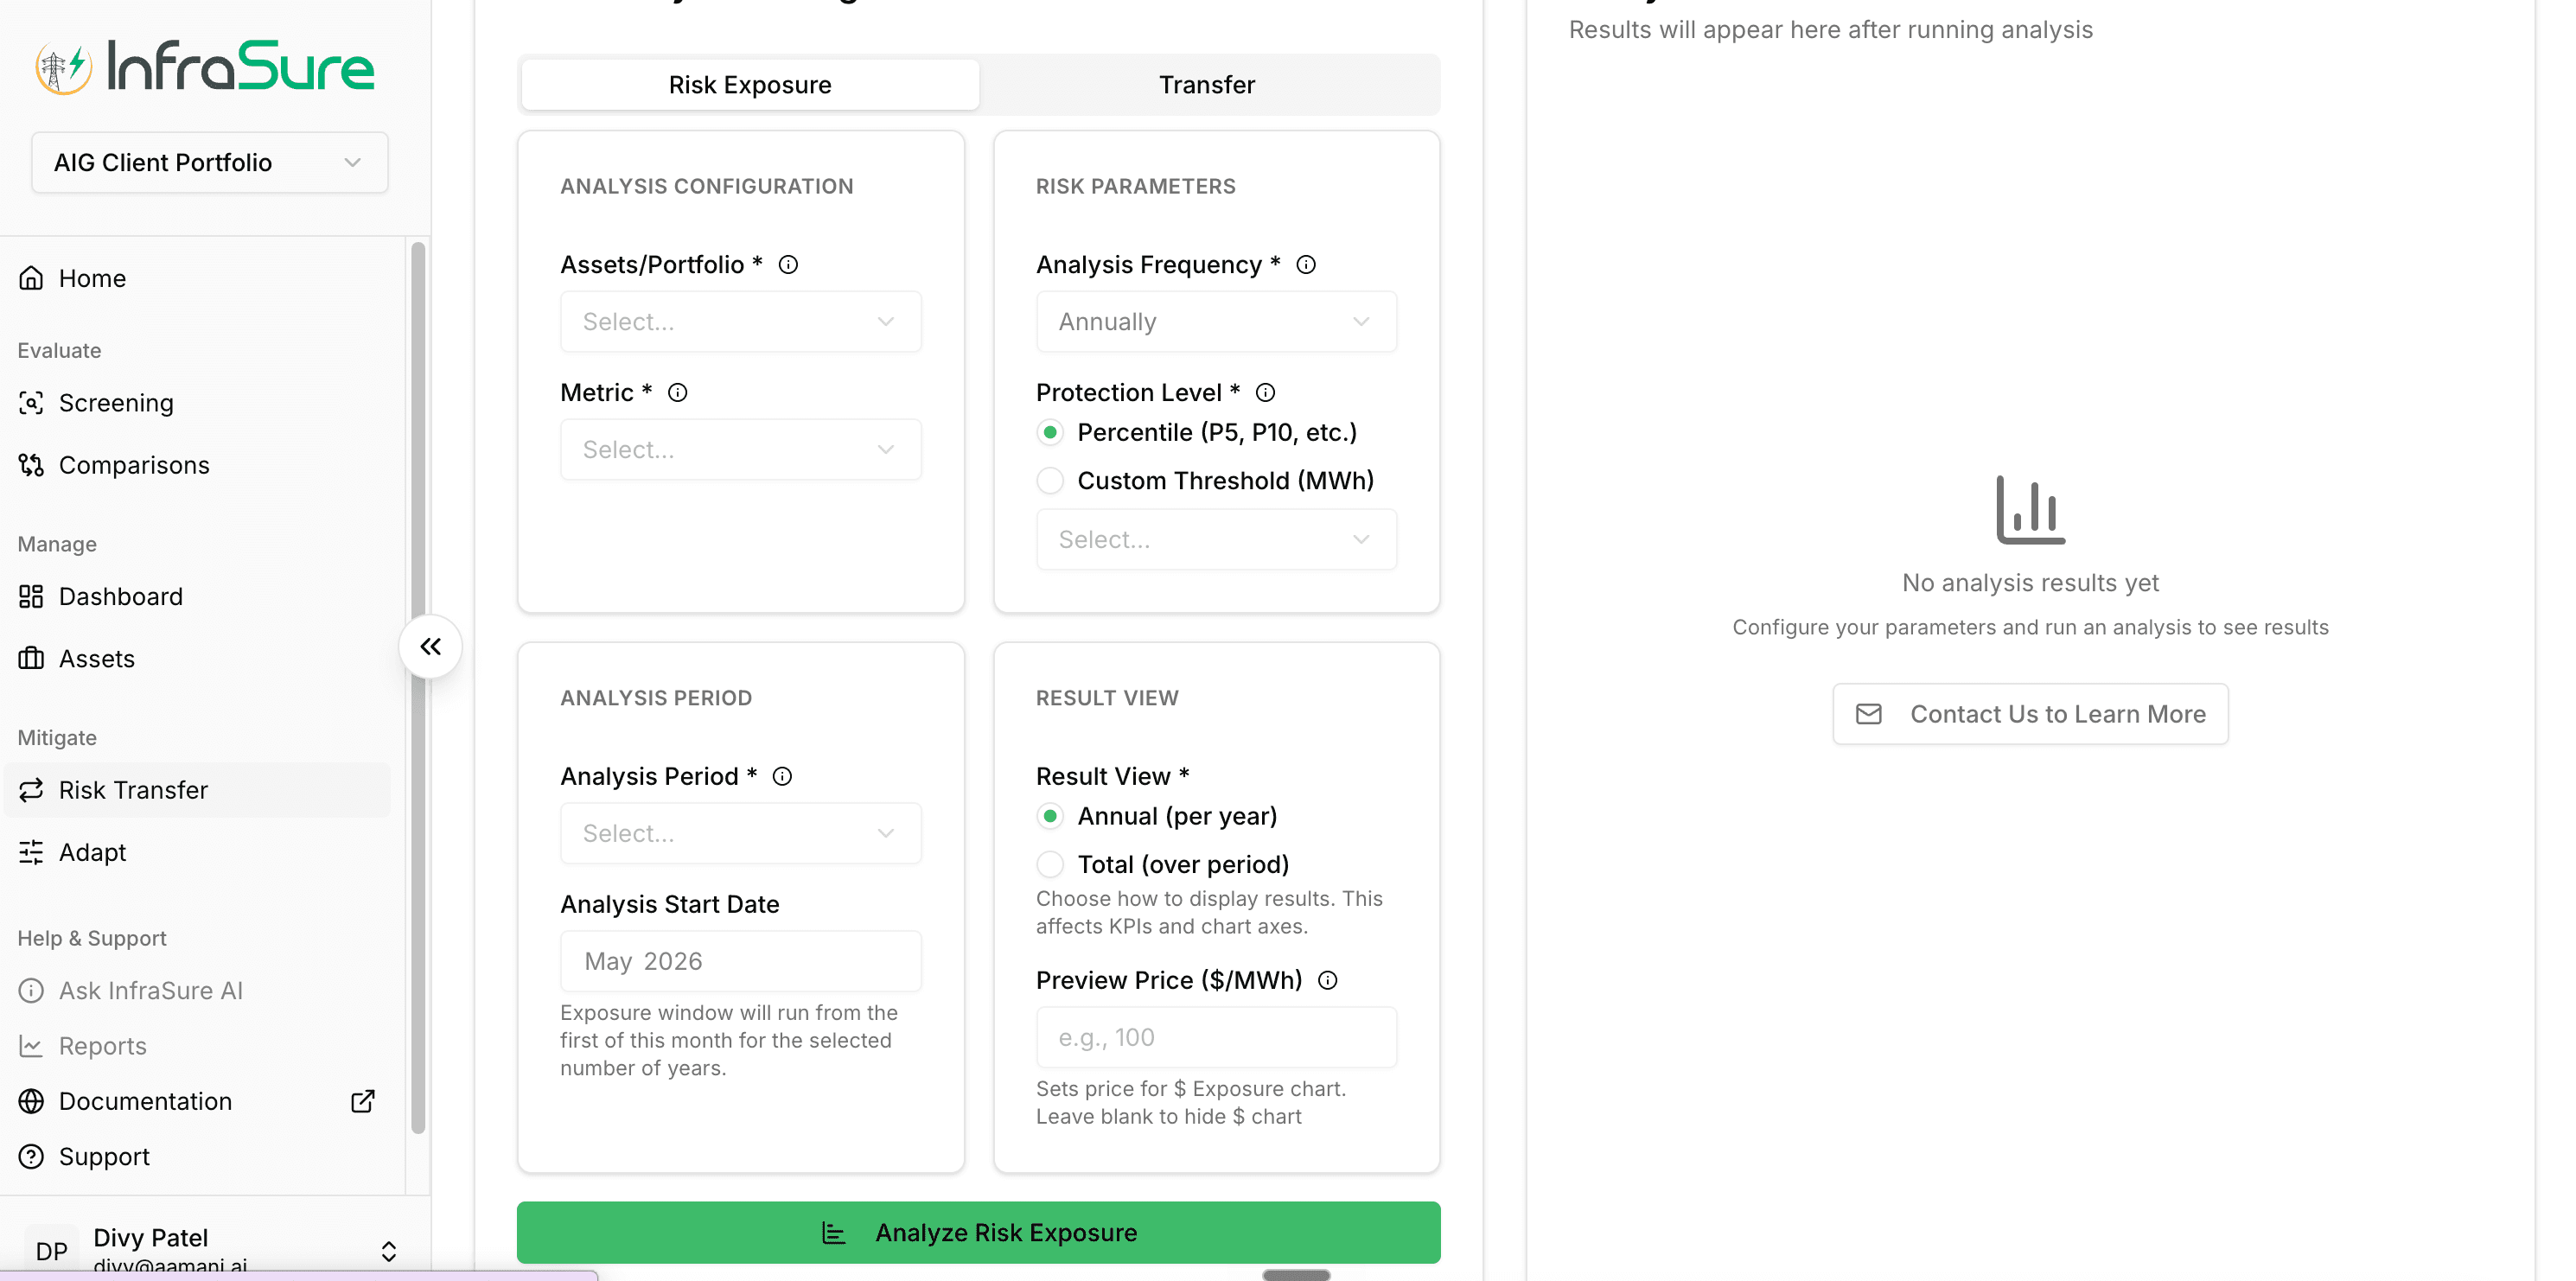
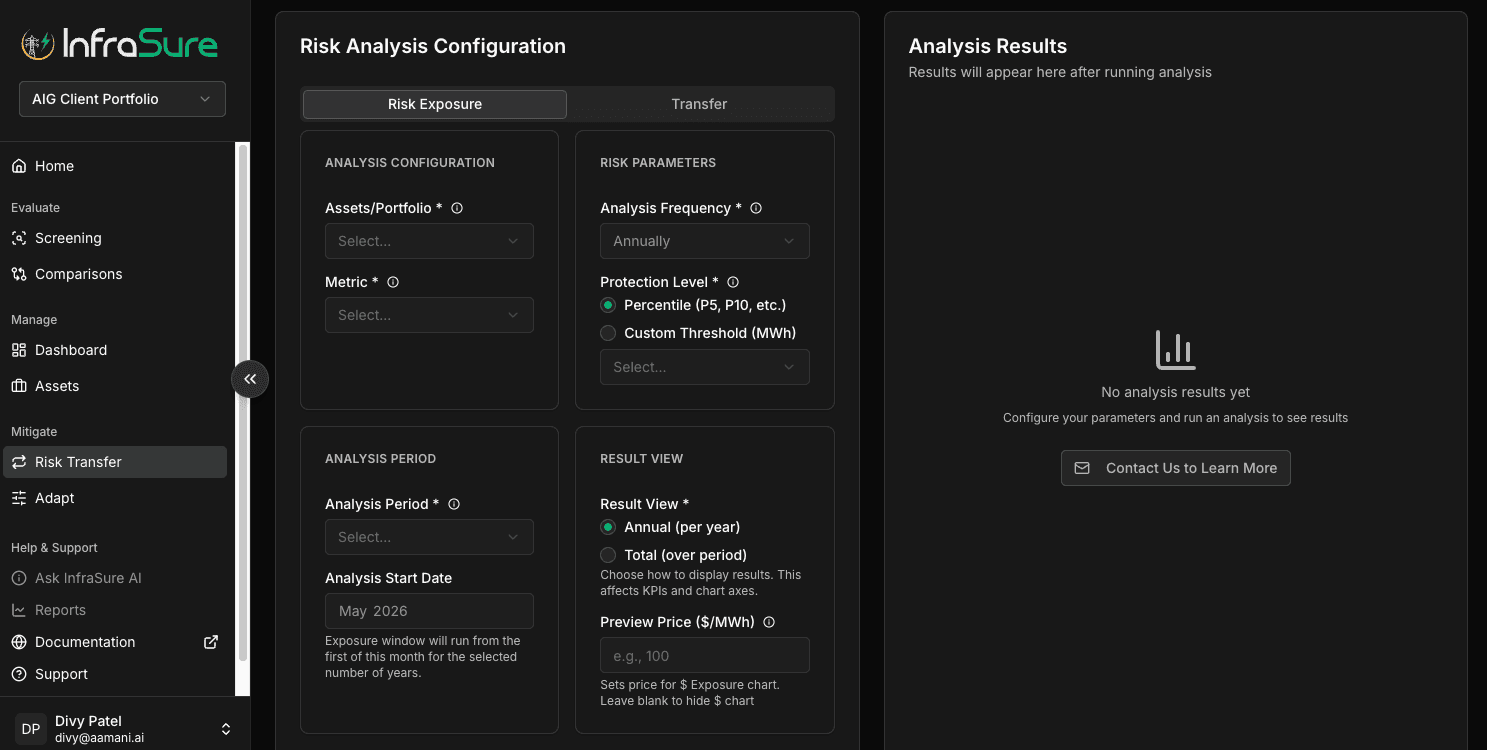
Risk Transfer / Parametric Risk Coverage configuration screen.
Parametric structure configuration: protection level, analysis frequency, and result view tied to the asset's modeled exposure.
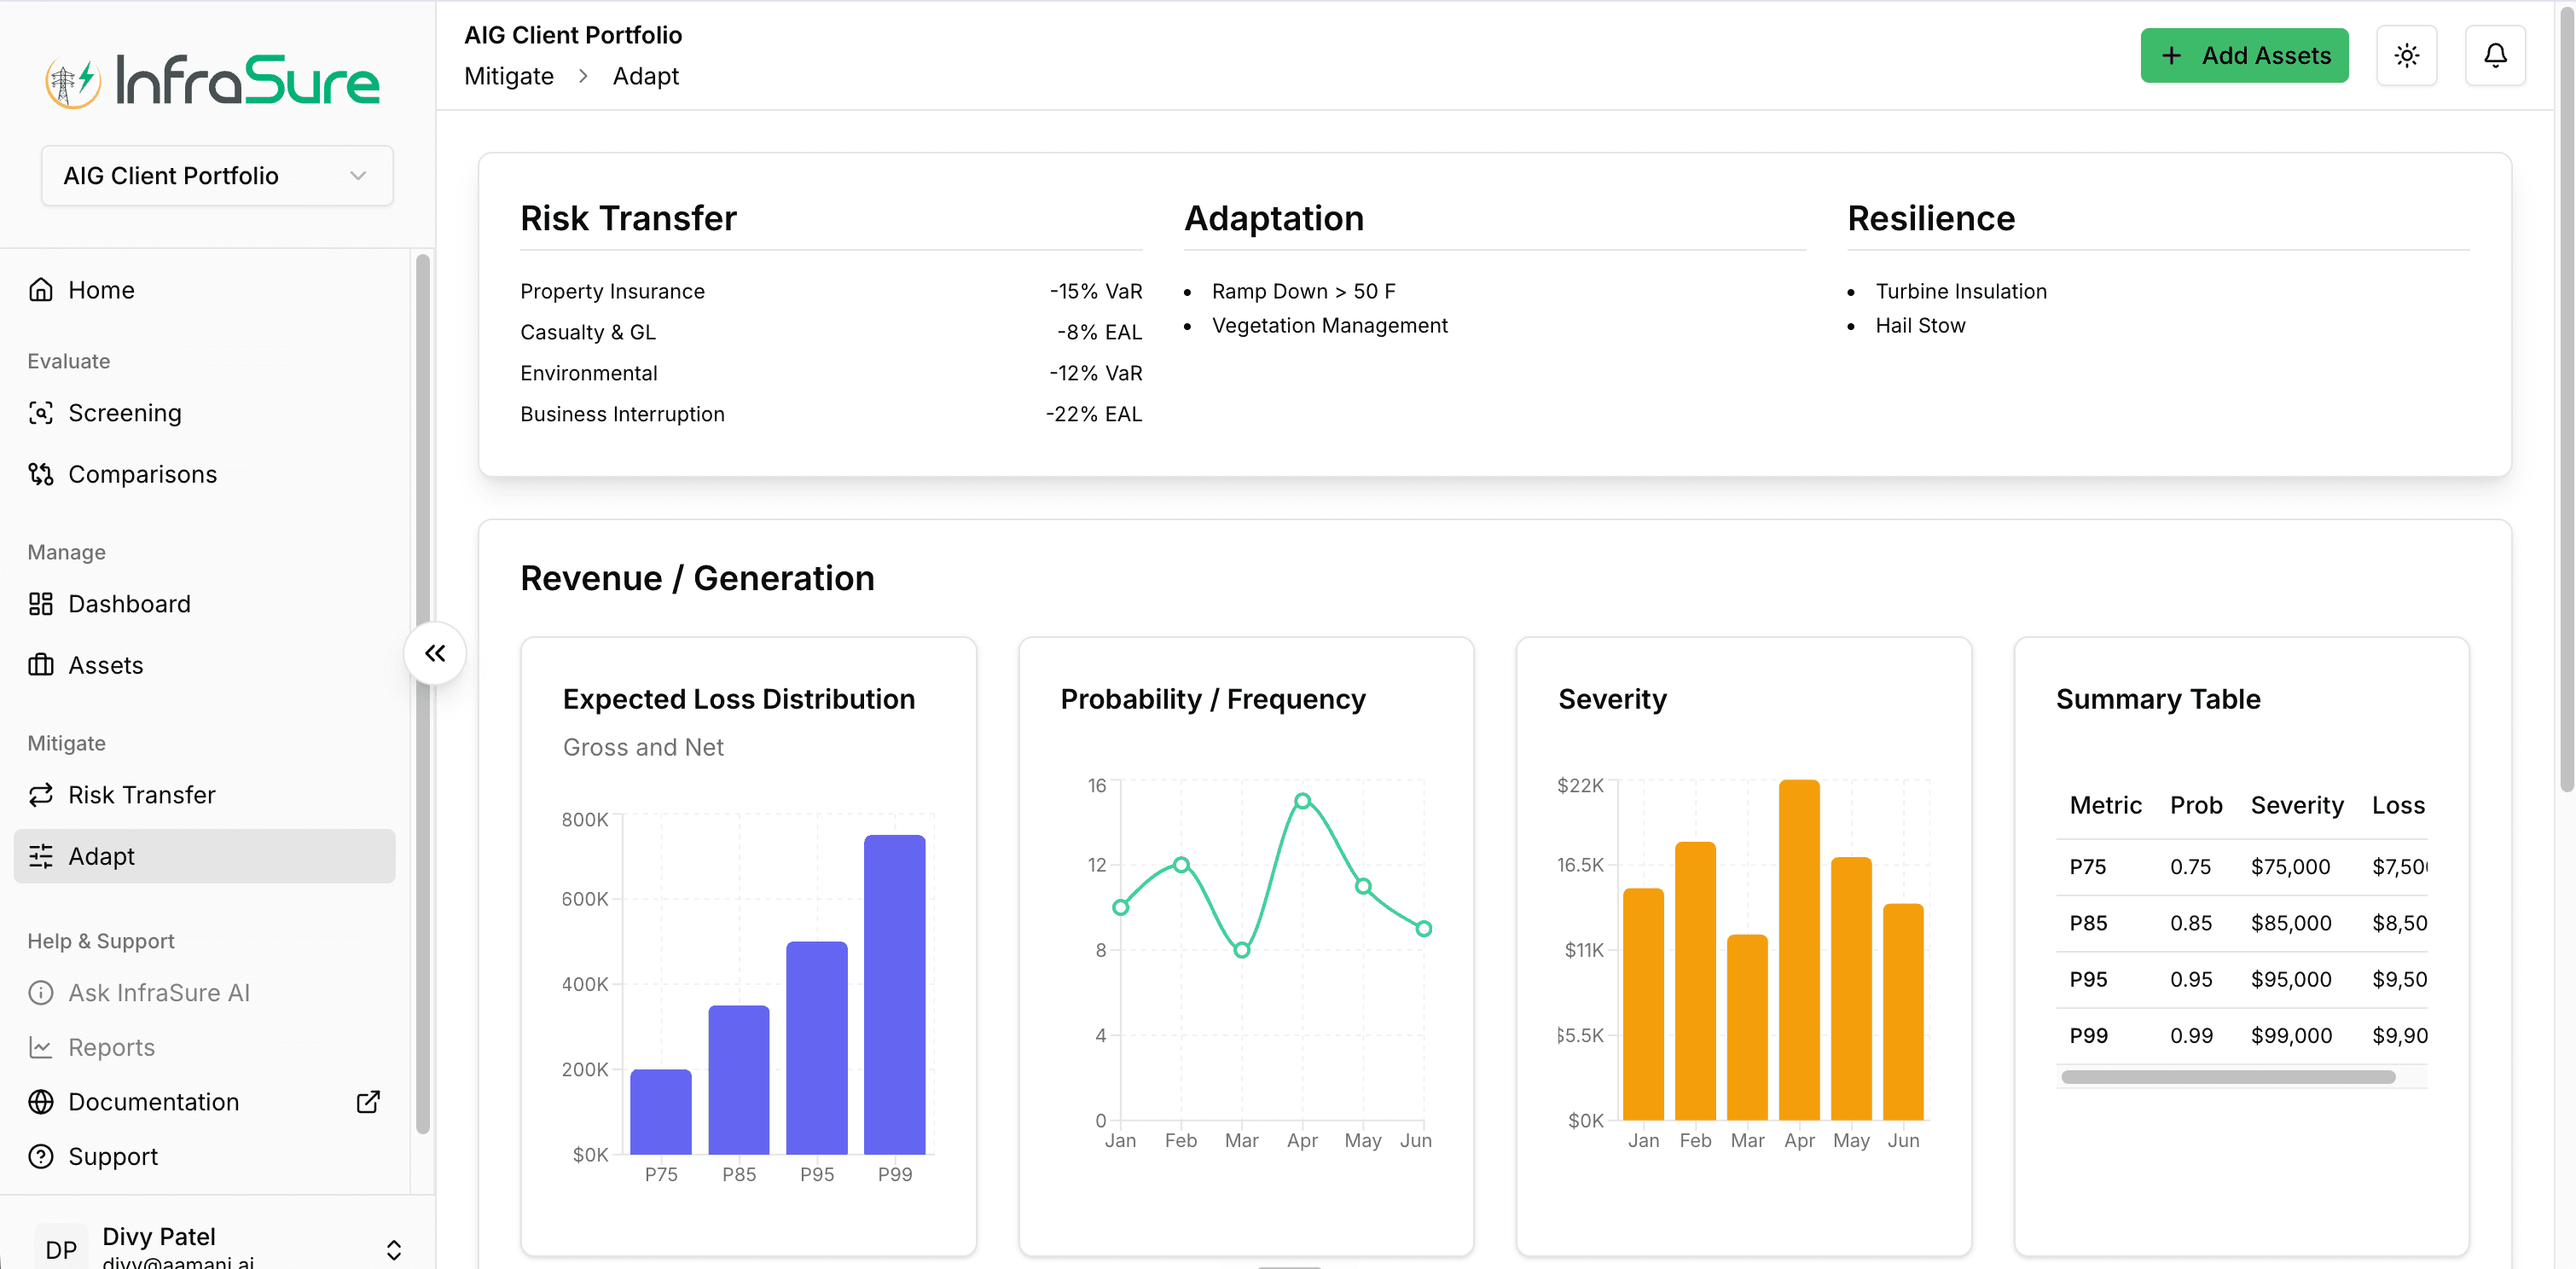
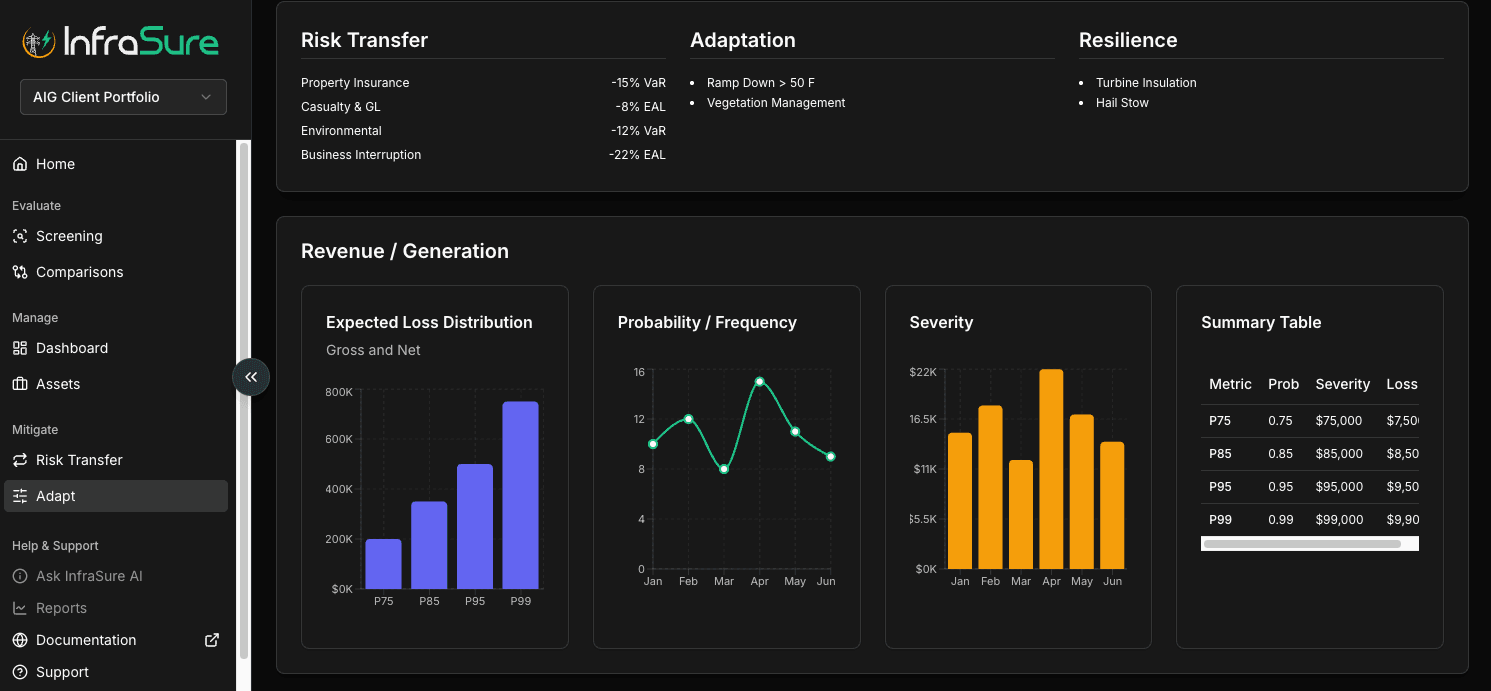
Mitigate / Adapt summary dashboard with Risk Transfer, Adaptation, and Resilience panels plus revenue/generation distributions.
Resilience measures ranked by EAL reduction, with insurance premium implications and revenue/generation distributions computed against the same scenarios.
Parametric structure design and trigger modeling
Coverage gap optimization across layers
Resilience spending ROI quantification
Adaptation ranked by cost-effectiveness
Composite mitigation stack modeling
Mitigation economics coherent with the underwriting view

The defining characteristic: the mitigation economics are not separate from the underwriting economics. The parametric trigger is calibrated against the same hazard distribution that drove the DSCR stress.

Why InfraSure

The advantages compound.

The platform is not a different version of an existing analytical product. It is a different layer of the stack — and the structural advantages don’t add. They compound.

Data Foundation

45 years of ERA5 reanalysis at hourly resolution. CMIP6 climate projections. 8+ years of nodal LMP across CAISO, ERCOT, MISO, PJM, SPP. Full EIA + USPVDB + USWTDB + CEC + NOAA + FEMA integration.

Weather-to-Cashflow Coherence

A single scenario produces simultaneously a hazard outcome, a generation outcome, a revenue outcome, a DSCR outcome, and an insurance trigger — all for the same asset under the same path.

Market-Scale Coverage

Every utility-scale plant in the U.S. — not just owned assets. The benchmark surface widens with every asset added; the gap to second-best compounds with each one.

Validation Discipline

Generation hindcast against EIA monthly actuals (MAE <10%). Hazards calibrated against FEMA NRI. Tail risk cross-checked against TWIA, Verisk, Aon. Backtested against Katrina, Uri, Camp Fire, 2020 Derecho.

InfraSure’s analytical engine compounds with every asset added. So does the gap to second-best.

The open foundation

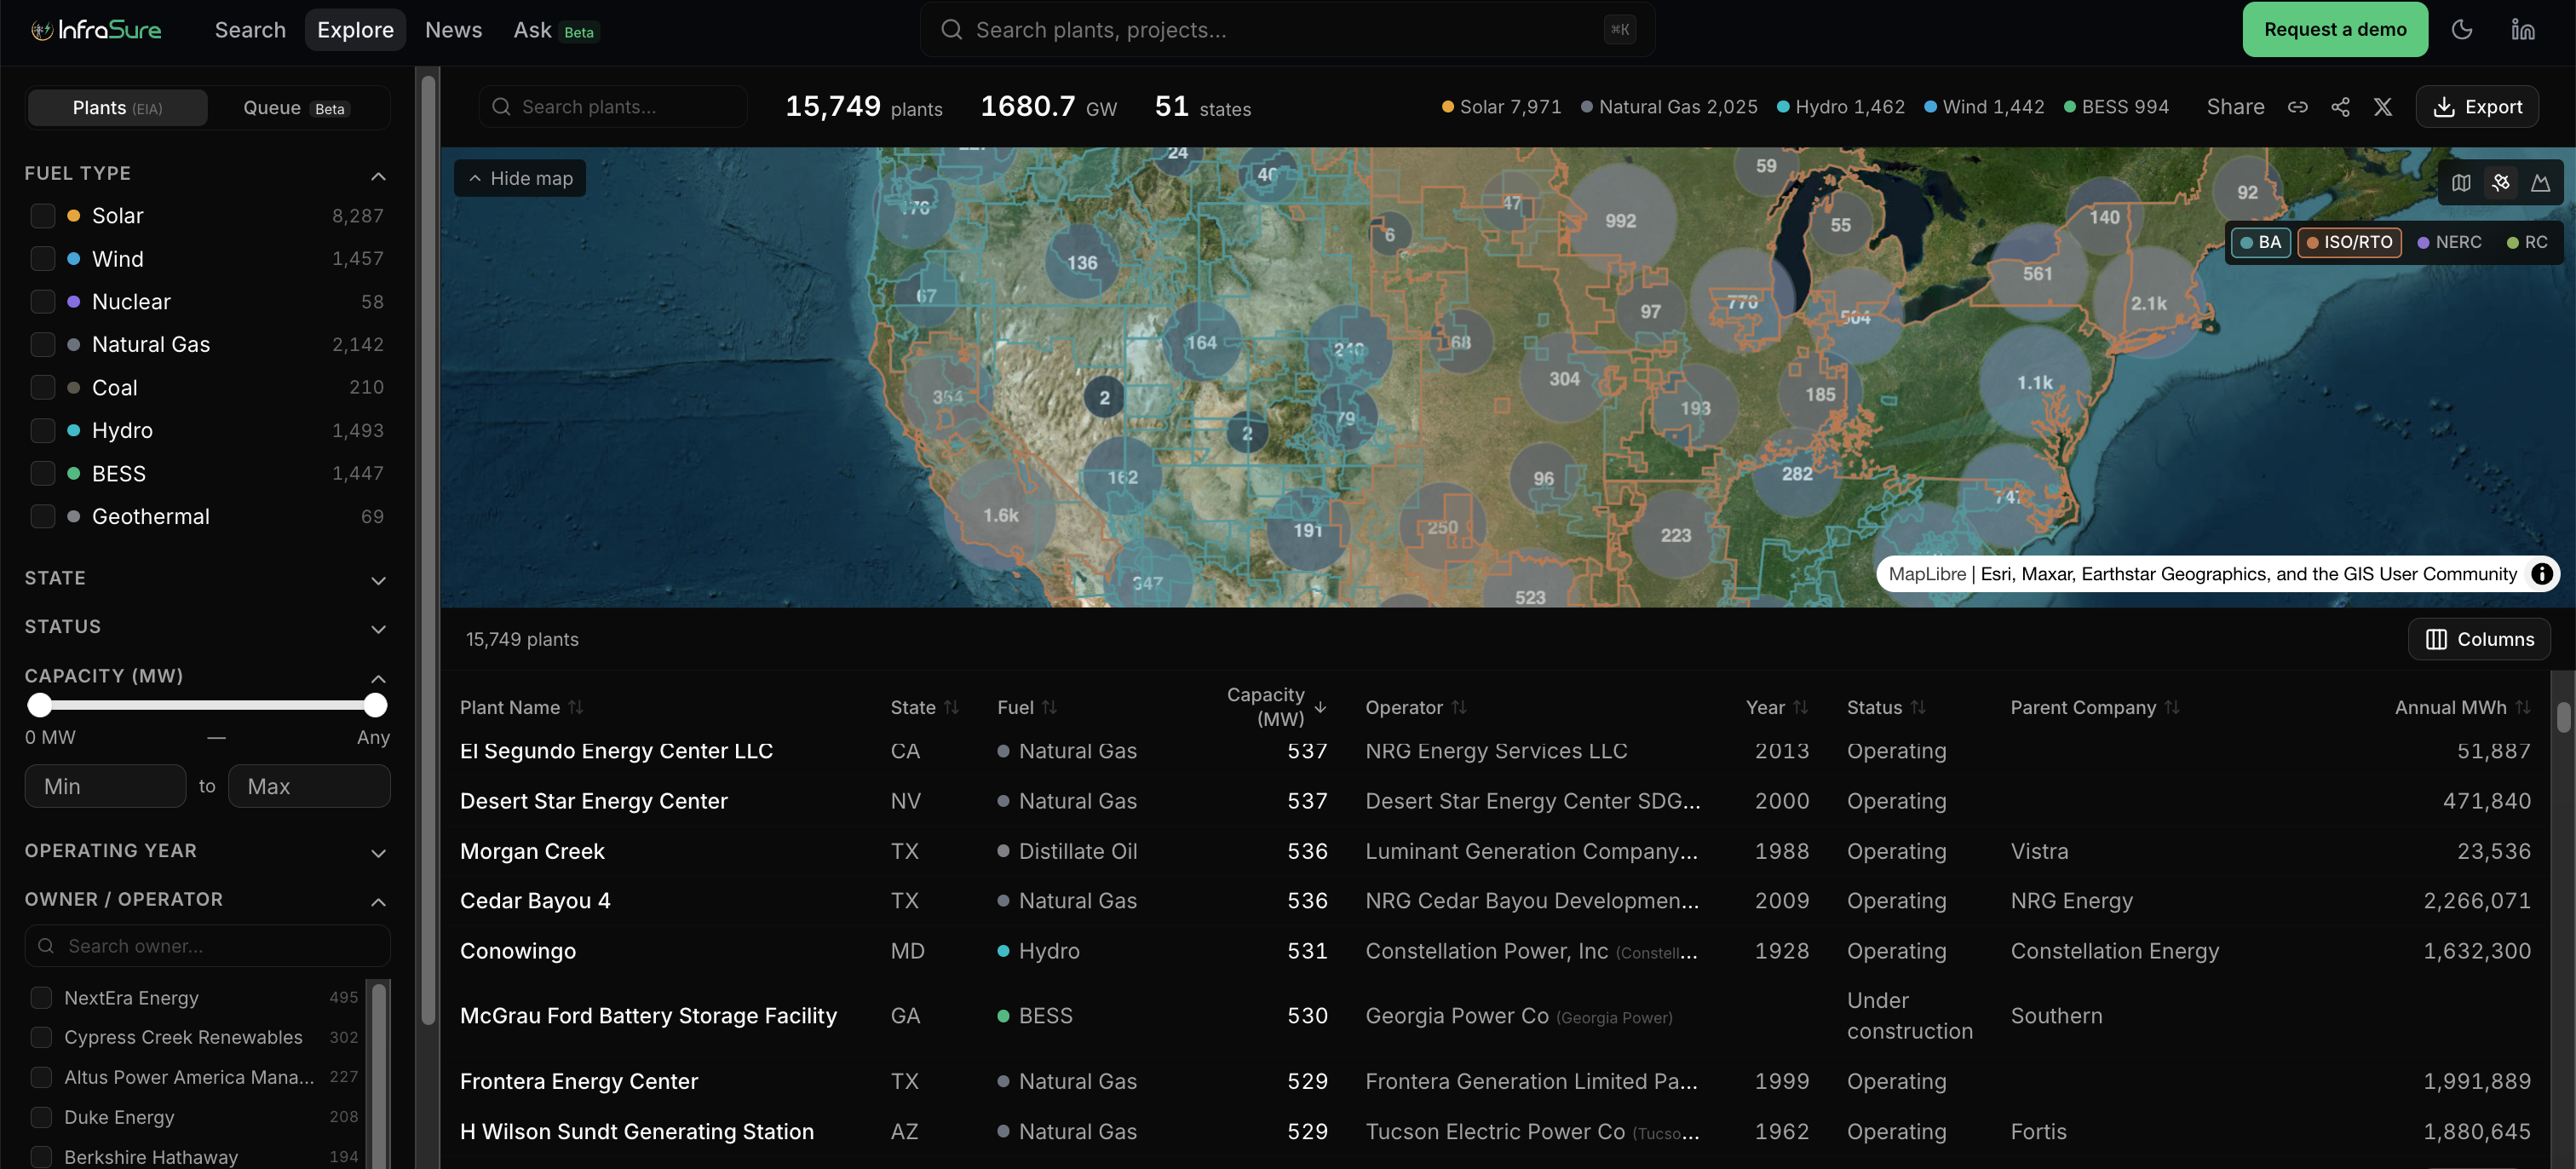
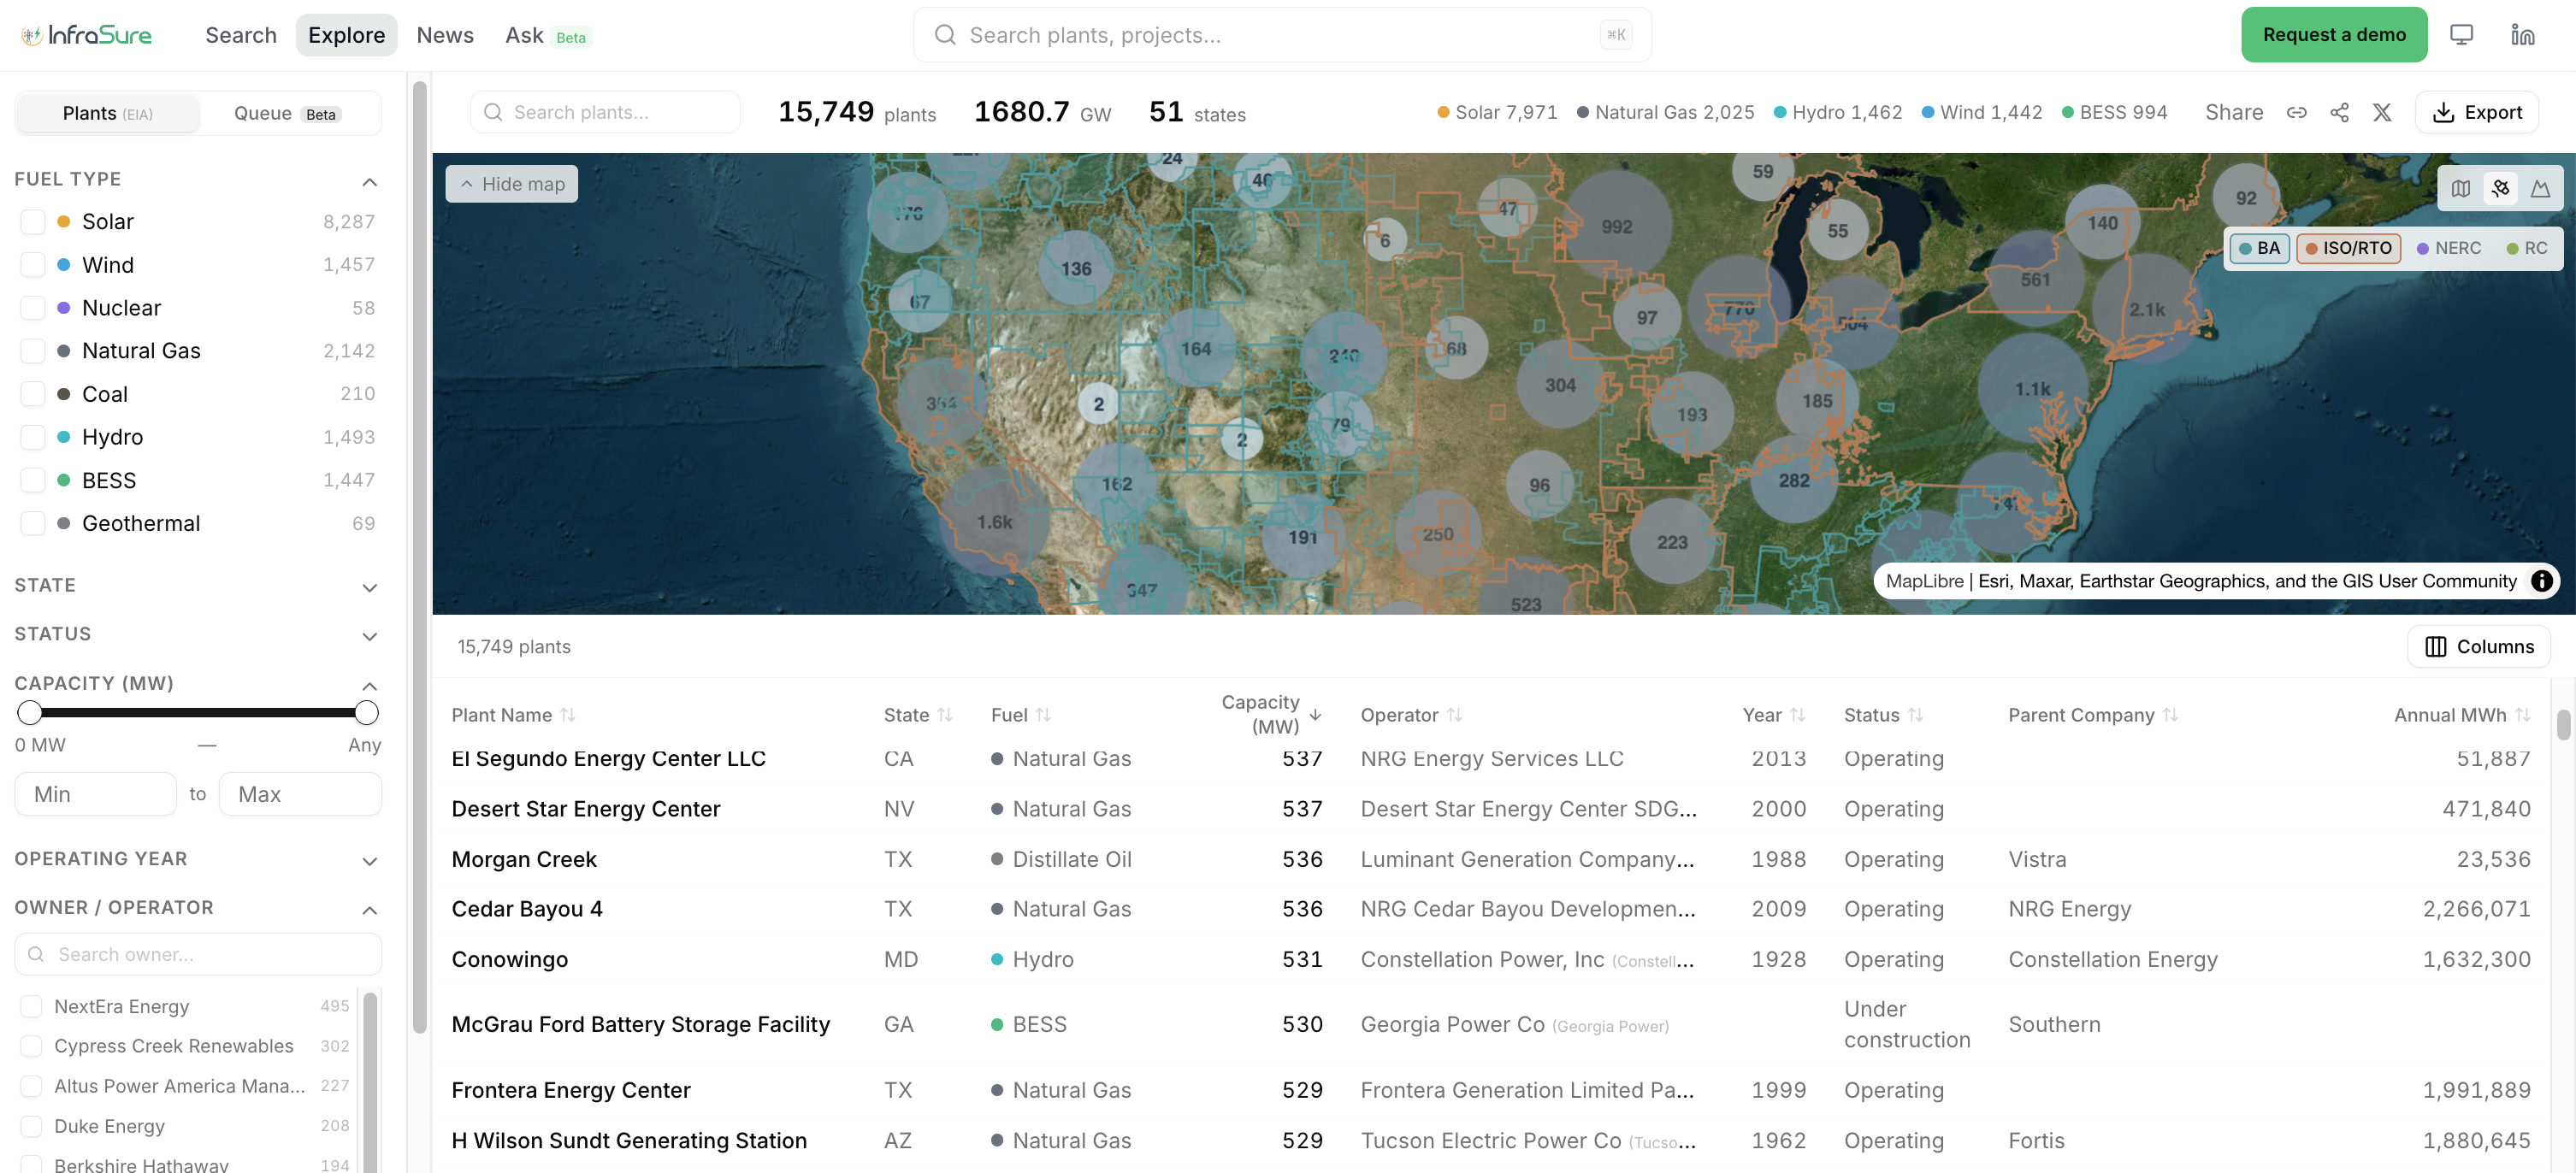
Every U.S. utility-scale plant. Every queue project. Every news flow. Open.

The same asset registry that powers our modeling layer is yours to explore.
Ready to see it on your own portfolio?

Price the risk before the market does.

We’ll walk you through your own portfolio in 30 minutes — the screening view, the underwriting depth, the mitigation economics. One asset of yours, end to end.

info@infrasure.ai